GenAM_CM_AI_Baskets
by Generali Investments
Your Partner for Progress. Generali Asset Management | Core Matters Our Core Matters series provides thematic research on macro, investment, and insurance topics Core Matters Riding the AI waves through thematic baskets
M. Morganti, M. Mammarella , V. Oleinikov , F. Tartara 21 October, 2026
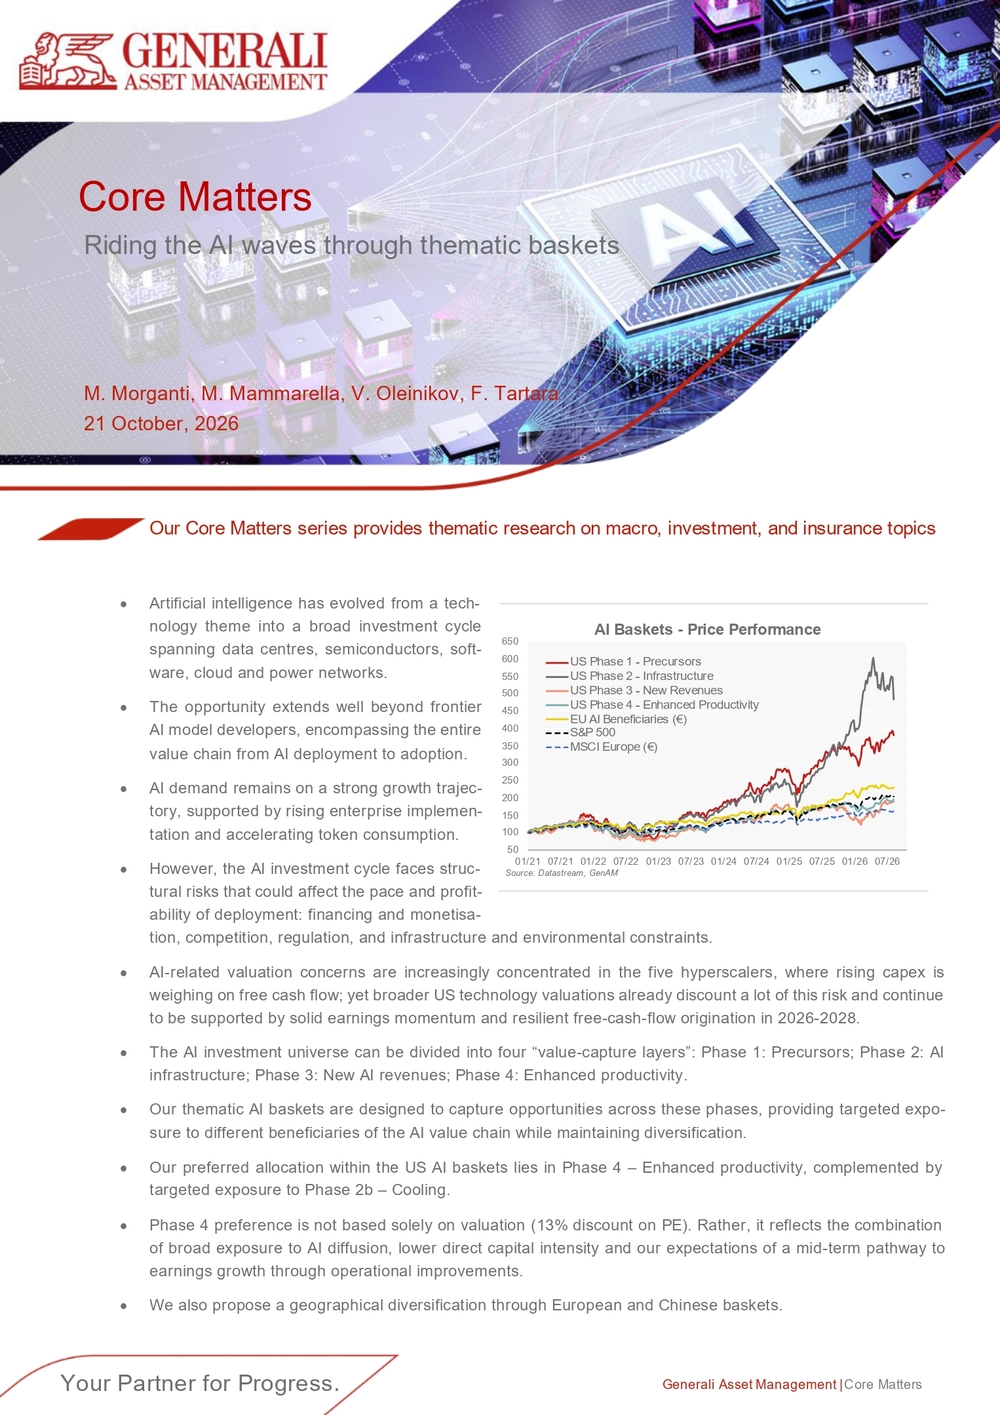
• Artificial intelligence has evolved from a tech- nology theme into a broad investment cycle spanning data centres, semiconductors, soft- ware, cloud and power networks. • The opportunity extends well beyond frontier AI model developers, encompassing the entire value chain from AI deployment to adoption. • AI demand remains on a strong growth trajec- tory, supported by rising enterprise implemen- tation and accelerating token consumption. • However, t he AI investment cycle faces struc- tural risks that could affect the pace and profit- ability of deployment: financing and monetisa- tion, competition, regulation, and infrastructure and environmental constraints . • AI-related valuation concerns are increasingly concentrated in the five hyperscalers, where rising capex is weighing on free cash flow; yet broader US technology valuations already discount a lot of this risk and continue to be supported by solid earnings momentum and resilient free-cash -flow origination in 2026 -2028 . • The AI investment universe can be divided into four “value -capture layers”: Phase 1: Precursors ; Phase 2: AI infrastructure; Phase 3: New AI revenues ; Phase 4: Enhanced productivity. • Our thematic AI baskets are designed to capture opportunities across these phases, providing targeted expo- sure to different beneficiaries of the AI value chain while maintaining diversification. • Our preferred allocation within the US AI baskets lies in Phase 4 – Enhanced productivity, complemented by targeted exposure to Phase 2b – Cooling . • Phase 4 preference is not based solely on valuation ( 13% discount on PE). Rather, it reflects the combination of broad exposure to AI diffusion, lower direct capital intensity and our expectations of a mid-term pathway to earnings growth through operational improvements. • We also propose a geographical diversification through European and Chin ese baskets . 50100150200250300350400450500550600650 01/21 07/21 01/22 07/22 01/23 07/23 01/24 07/24 01/25 07/25 01/26 07/26US Phase 1 - Precursors US Phase 2 - Infrastructure US Phase 3 - New Revenues US Phase 4 - Enhanced Productivity EU AI Beneficiaries (€) S&P 500 MSCI Europe (€)AI Baskets -Price Performance Source: Datastream, GenAM
2 Generali Asset Management | Core Matters Artificial Intelligence (AI) has evolved into a broad investment cycle spanning infra- struc ture, software and productivity -enhancing applications. This report is structured as follows. Section 1 assesses whether current demand trends, including token consump- tion, enterprise adoption and data -centre expansion, justify the scale of AI -related in- vestment currently underway. Section 2 reviews the main risks facing the AI invest- ment cycle, including monetisation, financing, competition, regulation and infrastructure constraints. Section 3 examines how these opportunities and risks are reflected in cur- rent market valuations , with a particular focus on hyperscalers and the broader US technology sector. Building on this analysis, Section 4 introduces our proprietary in- vestment framework , which divides the AI ecosystem into four value -capture layers and forms the basis of our thematic AI baskets. Finally, in Appendix we extend the framework to China and Europe , highlighting regional opportunities, risks and diversi- fication benefits.
- AI demand : so far, it justifies the capex AI is driving one of the largest investment cycles in modern technology history. Global AI-related infrastructure investment in 2026 is expected to be around $1 trillion , of which the largest part is in the US1. The key investment question is whether AI de- mand can justify the scale of capital expenditure currently underway. So far, the evi- dence is encouraging . 1.1 Token consumption Token consumption has becom e the main unit of AI demand. Unlike traditional software, typically measured by seats or subscriptions, AI usage is increasingly meas- ured in tokens: text, code, images and multimodal inputs processed by models. As AI expands into copilots , coding, search, analytics, customer support and , most of all, agents, token volumes grow much faster than the user base.
1 according to GS the US part is $581 bn; up to $800 bn according to BIS and the Columbia Business School
- AI demand: so far, it justifies the capex 2
- AI risks: what could derail the cycle 4
- US AI valuation: what is priced in? 6
- US AI baskets: investing along the value chain 9
- Conclusions: from building to adopting AI 14 Appendix A.1: China AI - exposure at a discount 15 Appendix A2: Europe - the industrial side of AI 17 IMPRINT 19
CONTENT
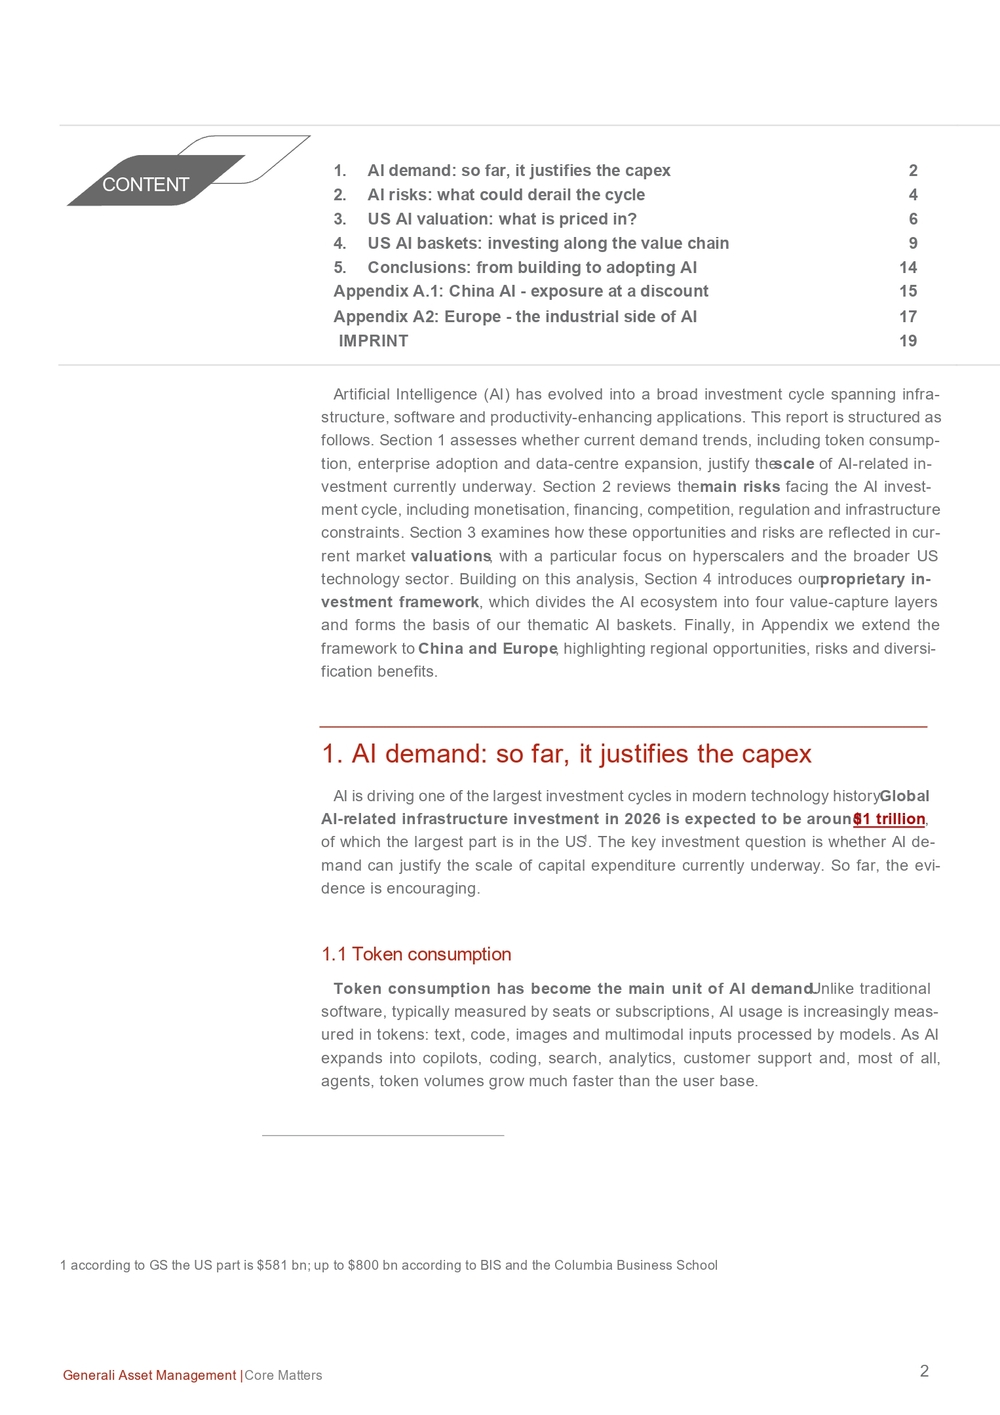
3 Generali Asset Management | Core Matters Weekly token utilisation on OpenRouter has risen this year from a few trillion tokens to over 1 50 trillion and should continue to increase as adoption broadens and agentic AI develops. Over the past three years, falling AI unit prices have been absorbed by rapid usage growth . In other words, cheaper and more efficient AI does not necessarily weaken the investment case. By stimulating additional demand and expanding the ad- dressable market, it can support continued infrastructure spending, although timely fi- nancial returns will depend on how quickly demand converts into durable revenues : see chapter below for further details , including mixed usage of cheaper and new frontier models . 1.2 A I adoption According to the Stanford AI Index report , 88% of surveyed organisations reported using AI in 2025, while 70% used generative AI in at least one business function. Dif- fusion has also been faster than for P ersonal Computers or the internet, reaching 53% adoption in the last three years , as also testified by S&P500 CEOs in the Q2 2026 reporting season . AI adoption is broad but shallow : experimentation is already widespread, while scaled deployment, workflow redesign and measurable financial returns remain at an early stage. A survey of 396 enterprises by Mavvrik and Benchmarkit found that, de- spite widespread cost tracking and formal budgets, only 11% could forecast AI spend- ing within a ±10% margin of accuracy. Unexpected AI costs are increasingly affecting margins and business decisions. Furthe rmore, m any firms are still in pilot mode, and AI agents are only starting to enter enterprise workflows , suggest ing that demand is still early in its cycle. The first wave came from experimentation, coding, content and knowledge work . The next wave will see deeper process integration, vertical applica- tions and agentic/ autonomous workflows. KAIST – a Korean Institute - estimates that if daily agent requests matched Google search volumes, AI would add ~200 GW of power demand — over 40% of average US grid load. This is a n illustrative upper bound rather than a forecast: it assumes static efficiency and full agent adoption.
020406080100120140160180 10/24 01/25 04/25 07/25 10/25 01/26 04/26 07/26Weekly Token Usage (in trillion tokens) Source: OpenRouter, GenAM $0.70$0.90$1.10$1.30$1.50$1.70$1.90$2.10 12/25 01/26 02/26 03/26 04/26 05/26 06/26 07/26 08/26 09/26 10/26SDLLMTK IndexToken Cost Index (USD per million token) Source: Silicon Data, Bloomberg, GenAM AI adoption is wide- spread; deeper integra- tion in businesses is the next growth driver
4 Generali Asset Management | Core Matters 1.3 Data centre expansion Data -centre expansion is the physical backbone of the AI opportunity. It also brings financing, cooling and operation al challenges into focus . McKinsey estimates that global data -centre capacity demand could rise from approximately 82 GW in 2025 to 219 GW by 2030 . AI-related capacity is expected to increase from around 44 GW to 156 GW, accounting for roughly 70% of total demand by the end of the decade. Brokers’ estimate of token utilisation rising from nearly 100 trillion in 2026 to almost 250 trillion in 2027 looks broadly consistent with the expected increase in installed GW capacity by 2030. The build -out is visible also in China2, which has around 24 GW of operational data-centre computing capacity and a further 50 GW under construction or announced, highlighting the increasingly global scale of the infrastructure race. 2. AI risks: what could derail the cycle The AI investment cycle faces structural risks that could affect the pace and profit- ability of deployment : there is the need to monitor financing , monetisation, competition and regulation, in addition to increasing infrastructure and environmental -political con- straints. The momentum in analysts’ revisions to revenues, margin s and operating prof- its (currently still positive) is also fundamental . 2.1 Financing risk As hyperscalers’ once -abundant free cash flow is increasingly absorbed by surging capex, AI investment is being funded more through debt . On average, r ising issu- ance has driven hyperscaler s’ credit spreads from 55bp s a year ago to 12 7bps today. The widening comes on top of already elevated Treasury yields, as large fiscal deficits and the AI capex supercycle reinforce upward pressure on long -term real rates – the fight for capital . The Bank for International Settlements has identified AI as a potential source of financial -system fragility, given the scale of investment, rising leverage and increasingly complex financing structures. According to the Wall Street Journal , the off - balance sheet commitments by Alphabet, Amazon, Meta and Microsoft amount to $2.4tn, four times the $604bn recorded on their balance sheets. Big US Tech debt also accounts for nearly 1% of benchmark indices for euro -denominated corporate bonds, with $40bn of bonds, and 10% of gross issuance in euros. Should returns disappoint, a repricing of risk could tighten financing conditions and slow infrastructure investment , reducing productivity gains . The key issue is therefore whether AI capex can generate durable revenues and acceptable returns on capital , and whether such risk s are already sufficiently priced in by the market (see chapter 3 on valuation ).
2 E. Olcott, China races to build data centres in bid for AI supremacy, Financial Times, 8 October 2026
5 Generali Asset Management | Core Matters 2.2 Competit ion risk Competition is intensifying across the AI ecosystem. Lower -cost Chinese models, ad- vances in semiconductor capabilities and the wider availability of open -source solutions are challenging incumbent US providers and encouraging companies to consider cheaper alternatives to proprietary systems . This is accelerating commoditisation and driving prices down. Enterprises are therefore likely to optimise their model usage by deploying cheaper open -weight models for simpler tasks, and reserving frontier models for the most advanced or demanding applications. This shift is already visible in usage patterns: in August, open -weight models accounted for 56% of all tokens pro- cessed through Vercel’s AI Gateway, up from just 7% in December3. Lower prices could accelerate adoption but also compress margins and weaken pric- ing power a mong hyperscalers, model developers and semiconductor companies. The key risk is not weaker AI demand, but a redistribution of economic value across the value chain, including towards newer entrants, in ways that differ from current market expectations. 2.3 Regulatory risk Rules governing AI safety, data privacy, intellectual property and competition may increase compliance costs, delay deployment, restrict data access or limit specific ap- plications. Regulatory fragmentation across jurisdictions could further complicate im- plementation and reduce the scalability of global business models. The US midterms election will matter , too. A Democratic sweep of Congress in November 2026 could increase regulatory scrutiny across the AI value chain, including on data -centre devel- opment, permitting, power consumption and water usage. For now, President Trump would likely veto any regulatory tightening, but investors may be looking forward to the 2028 elections and fear a tightening from 2029. 2.4 Infrastructure and E nvironmental constraints Agentic AI mass adoption may push data -centre emissions to 1.2 Gt by 2030, accord- ing to M organ Stanley , above Japan's annual emissions. The sustainability case rests on whether AI -enabled GHG savings can reach up to 5.4 Gt, as recent research sug- gests. Power, cooling and water availability are becoming critical constraints on AI ex- pansion. Goldman Sachs Research expects data -centre power demand to rise by around 220% from 2023 to 2030 . Data -centre supply may struggle to keep pace: there could be a potential 20% -30% US power shortage versus demand through 2028. According to the Stanford AI Index, AI data -centre capacity is comparable to New York State’s peak electricity demand , while the annual water consumption
3 Corporate America eyes cheaper AI options, McMorrow & Hammond, Financial Times, 5/10/26 Power and cooling availability is becoming the main constraint on AI scaling
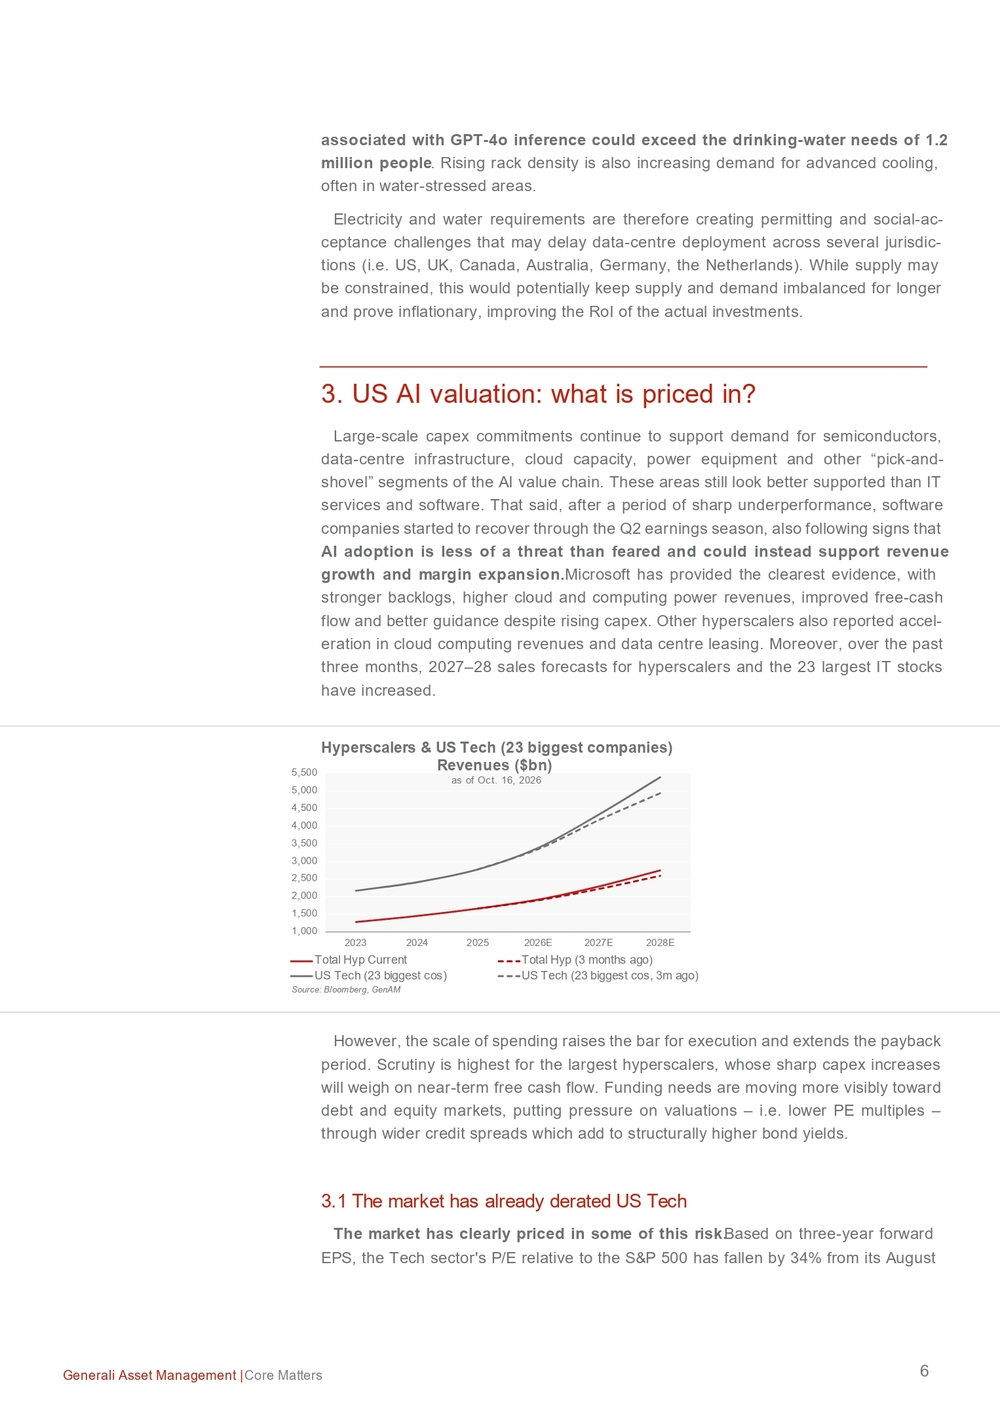
6 Generali Asset Management | Core Matters associated with GPT -4o inference could exceed the drinking -water needs of 1.2 million people . Rising rack density is also increasing demand for advanced cooling, often in water -stressed areas. Electricity and water requirements are therefore creating permitting and social -ac- ceptance challenges that may delay data -centre deployment across several jurisdic- tions (i.e. US, UK, Canada, Australia, Germany, the Netherlands). While supply may be constrained , this would potentially keep supply and demand imbalance d for longer and prove inflationary, improving the RoI of the actual investments. 3. US AI valuation : what is priced in? Large -scale capex commitments continue to support demand for semiconductors, data-centre infrastructure, cloud capacity, power equipment and other “pick -and- shovel” segments of the AI value chain. These areas still look better supported than IT services and software . That said, a fter a period of sharp underperformance, software companies started to recover through the Q2 earnings season , also following signs that AI adoption is less of a threat than feared and could instead support revenue growth and margin expansion . Microsoft has provided the clearest evidence , with stronger backlogs , higher cloud and computing power revenues , improved free-cash flow and better guidance despite rising capex . Other hyperscalers also reported accel- eration in cloud computing revenues and data centre leasing . Moreover, over the past three months, 2027 –28 sales forecasts for hyperscalers and the 23 largest IT stocks have increased. However , the scale of spending raises the bar for execution and extends the payback period . Scrutiny is highest for the largest hyperscalers, whose sharp capex increases will weigh on near -term free cash flow. Funding needs are moving more visibly toward debt and equity markets, put ting pressure on valuations – i.e. lower PE multiples – through wider credit spreads which add to structural ly higher bond yields . 3.1 The market has already derated US Tech The market has clearly price d in some of this risk. Based on three -year forward EPS, the Tech sector's P/E relative to the S&P 500 has fallen by 34% from its August
1,0001,5002,0002,5003,0003,5004,0004,5005,0005,500 2023 2024 2025 2026E 2027E 2028E Total Hyp Current Total Hyp (3 months ago) US Tech (23 biggest cos) US Tech (23 biggest cos, 3m ago)Hyperscalers & US Tech (23 biggest companies) Revenues ($bn) as of Oct. 16, 2026 Source: Bloomberg, GenAM
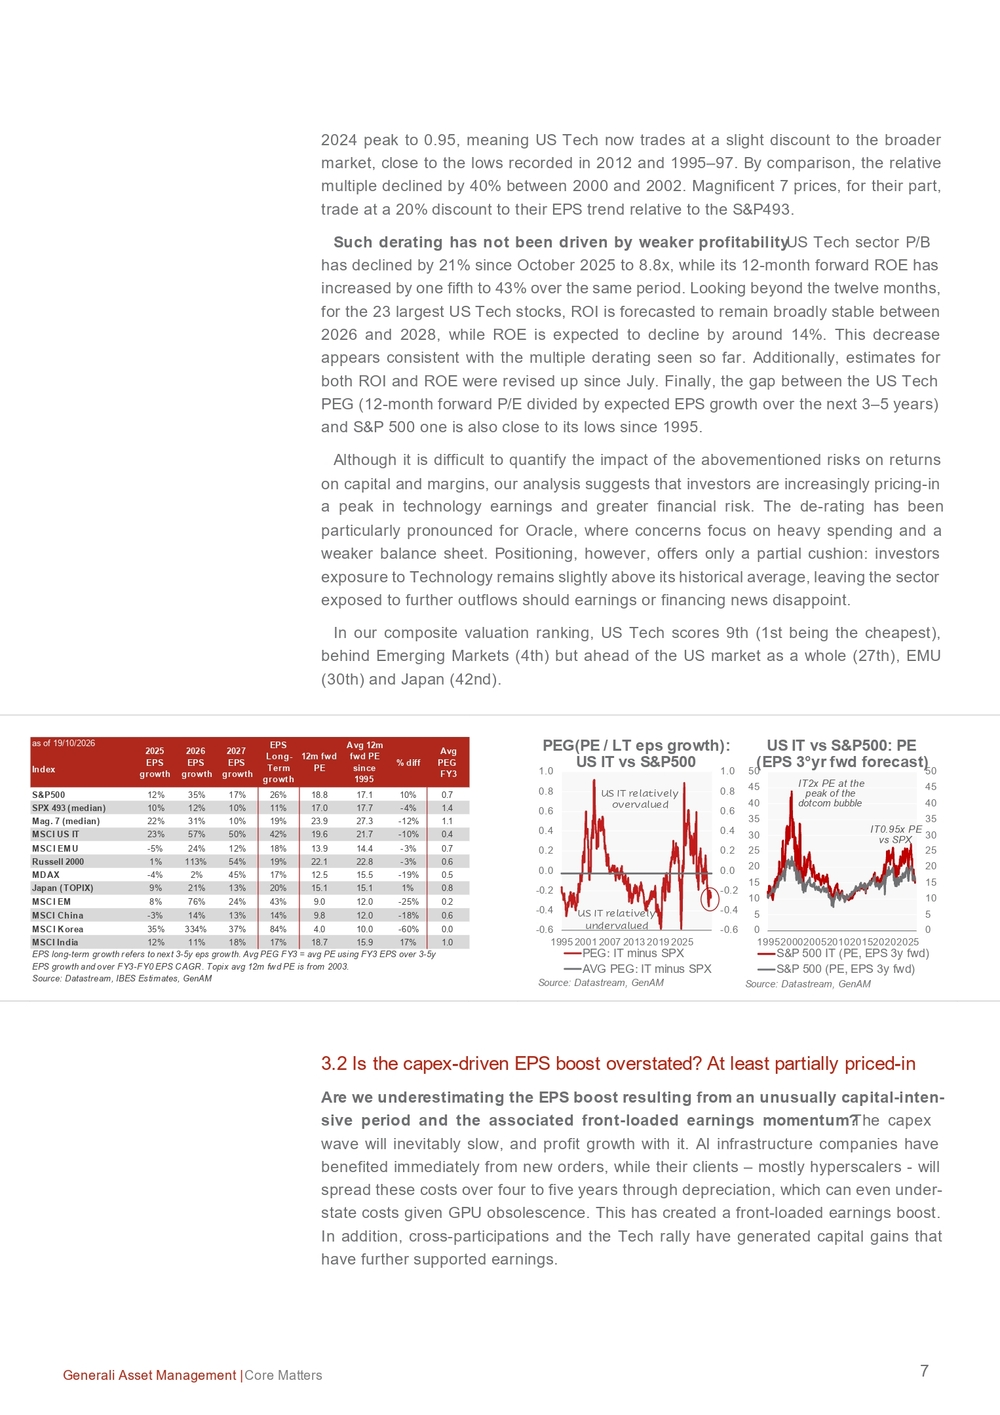
7 Generali Asset Management | Core Matters 2024 peak to 0.95, meaning US Tech now trades at a slight discount to the broader market, close to the lows recorded in 2012 and 1995 –97. By comparison, the relative multiple declined by 40% between 2000 and 20 02. Magnificent 7 prices , for their part, trade at a 20% discount to their EPS trend relative to the S&P493. Such derating has not been driven by weaker profitability . US Tech sector P/B has declined by 21% since October 2025 to 8.8x, while its 12 -month forward ROE has increased by one fifth to 43% over the same period. Looking beyond the twelve months , for the 23 largest US Tech stocks, ROI is forecast ed to remain broadly stable between 2026 and 2028, while ROE is expected to decline by around 14%. This decrease appears consistent with the multiple derating seen so far. Additionally, estimates for both ROI and ROE were revised up since July. Finally, the gap between the US Tech PEG (12 -month forward P/E divided by expected EPS growth over the next 3 –5 years) and S&P 500 one is also close to its lows since 1995. Although it is difficult to quantify the impact of the abovementioned risks on returns on capital and margins, our analysis suggests that investors are increasingly pricing -in a peak in technology earnings and greater financial risk. The de -rating has been particularly pronounced for Oracle, where concerns focus on heavy spending and a weaker balance sheet. Positioning, however, offers only a partial cushion: investor s exposure to Technology remains slightly above its historical average, leaving the sector exposed to further outflows should earnings or financing news disappoint. In our composite valuation ranking, US Tech scores 9th (1st being the cheapest), behind Emerging Markets (4th) but ahead of the US market as a whole (27th), EMU (30th) and Japan (42nd). 3.2 Is the capex -driven EPS boost overstated? At least partially p riced -in Are we underestimating the EPS boost resulting from an unusually capital -inten- sive period and the associated front -loaded earnings momentum? The capex wave will inevitably slow , and profit growth with it . AI infrastructure companies have benefit ed immediately from new orders, while their clients – mostly hyperscalers - will spread the se costs over four to five years through depreciation , which can even under- state costs given GPU obsolescence . This has creat ed a front-loaded earnings boost . In addition , cross-participations and the Tech rally have generated capital gains that have further supported earnings .
as of 19/10/2026 Index S&P500 12% 35% 17% 26% 18.8 17.1 10% 0.7 SPX 493 (median) 10% 12% 10% 11% 17.0 17.7 -4% 1.4 Mag. 7 (median) 22% 31% 10% 19% 23.9 27.3 -12% 1.1 MSCI US IT 23% 57% 50% 42% 19.6 21.7 -10% 0.4 MSCI EMU -5% 24% 12% 18% 13.9 14.4 -3% 0.7 Russell 2000 1% 113% 54% 19% 22.1 22.8 -3% 0.6 MDAX -4% 2% 45% 17% 12.5 15.5 -19% 0.5 Japan (TOPIX) 9% 21% 13% 20% 15.1 15.1 1% 0.8 MSCI EM 8% 76% 24% 43% 9.0 12.0 -25% 0.2 MSCI China -3% 14% 13% 14% 9.8 12.0 -18% 0.6 MSCI Korea 35% 334% 37% 84% 4.0 10.0 -60% 0.0 MSCI India 12% 11% 18% 17% 18.7 15.9 17% 1.0Avg 12m fwd PE since 1995% diffAvg PEG FY3 EPS long-term growth refers to next 3-5y eps growth. Avg PEG FY3 = avg PE using FY3 EPS over 3-5y EPS growth and over FY3-FY0 EPS CAGR. Topix avg 12m fwd PE is from 2003. Source: Datastream, IBES Estimates, GenAM2025 EPS growth2026 EPS growth2027 EPS growthEPS Long- Term growth12m fwd PE
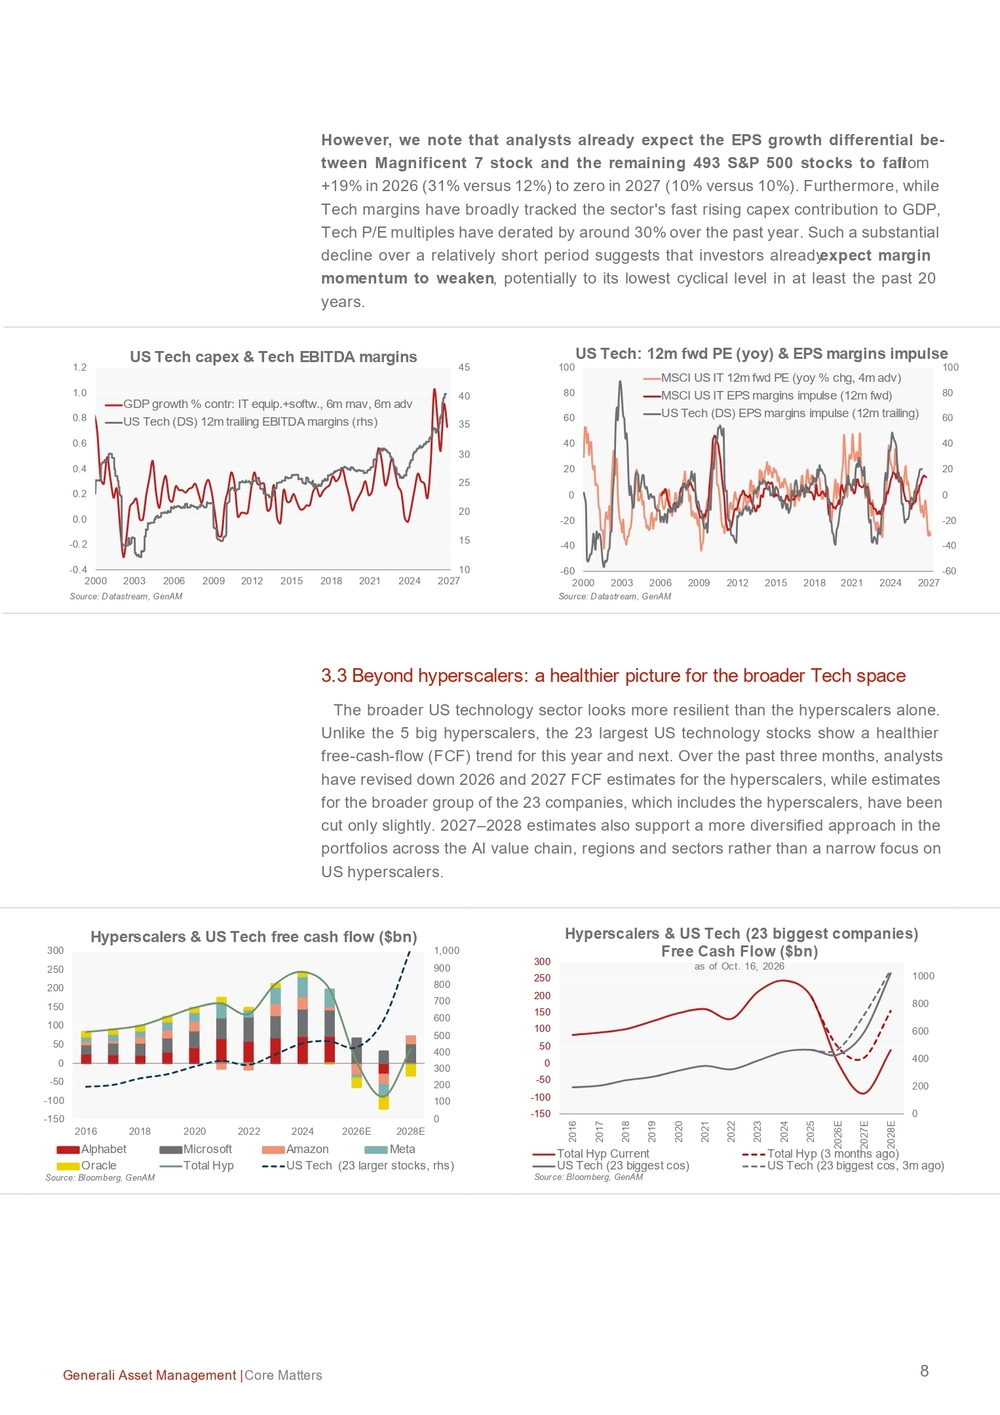
8 Generali Asset Management | Core Matters However , we note that a nalysts already expect the EPS growth differential be- tween Magnificent 7 stock and the remaining 493 S&P 500 stocks to fall from +19% in 2026 (31% versus 12%) to zero in 2027 (10% versus 10%). Furthermore, while Tech margins have broadly tracked the sector's fast rising capex contribution to GDP , Tech P/E multiples have derated by around 30% over the past year. Such a substantial decline over a relatively short period suggests that investors already expect margin momentum to weaken , potentially to its lowest cyclical level in at least the past 20 years. 3.3 Beyond hyperscalers: a healthier picture for the broader Tech space The broader US technology sector looks more resilient than the hyperscalers alone. Unlike the 5 big hyperscalers, the 23 largest US technology stocks show a healthier free-cash -flow (FCF) trend for this year and next. Over the past three months, analysts have revised down 2026 and 2027 FCF estimates for the hyperscalers, while estimates for the broader group of the 23 companies , which includ es the hyperscalers, have been cut only slightly. 2027–2028 estimates also support a more diversified approach in the portfolios across the AI value chain, regions and sectors rather than a narrow focus on US hyperscalers.
1015202530354045 -0.4-0.20.00.20.40.60.81.01.2 2000 2003 2006 2009 2012 2015 2018 2021 2024 2027GDP growth % contr: IT equip.+softw., 6m mav, 6m adv US Tech (DS) 12m trailing EBITDA margins (rhs)US Tech capex & Tech EBITDA margins Source: Datastream, GenAM -60-40-20020406080100 -60-40-20020406080100 2000 2003 2006 2009 2012 2015 2018 2021 2024 2027MSCI US IT 12m fwd PE (yoy % chg, 4m adv) MSCI US IT EPS margins impulse (12m fwd) US Tech (DS) EPS margins impulse (12m trailing)US Tech: 12m fwd PE (yoy) & EPS margins impulse Source: Datastream, GenAM 01002003004005006007008009001,000 -150-100-50050100150200250300 2016 2018 2020 2022 2024 2026E 2028E Alphabet Microsoft Amazon Meta Oracle Total Hyp US Tech Source: Bloomberg, GenAMHyperscalers & US Tech free cash flow ($bn) (23 larger stocks, rhs) 02004006008001000 -150-100-50050100150200250300 2016 2017 2018 2019 2020 2021 2022 2023 2024 2025 2026E 2027E 2028ETotal Hyp Current Total Hyp (3 months ago) US Tech (23 biggest cos) US Tech (23 biggest cos, 3m ago)Hyperscalers & US Tech (23 biggest companies) Free Cash Flow ($bn) as of Oct. 16, 2026 Source: Bloomberg, GenAM
9 Generali Asset Management | Core Matters 4. US AI baskets: investing along the value chain The AI investment case is not a single trade but a progression along the value chain . Value may transition from the most visible earnings beneficiaries , the Magnificent 7 (Alphabet, Amazon, Apple, Meta, Microsoft, Nvidia, Tesla) , to infrastructure providers, then to companies monetising AI through products, and finally to broader productivity beneficiaries. A basket approach helps reduce concentration risk while maintaining ex- posure to the full AI opportunity set . Our framework is based on the detection of four phases , which are to be intended as “value -capture layers” or “waves” rather than chronological phases :
- Phase 1 – Precursors (Magnificent 7 ): valid ates AI as an earnings and capex theme, with Nvidia monetising comput ing scarcity and the broader Magnificent 7 amplifying computing demand by building AI capacity and applications.
- Phase 2 – AI infrastructure: industrialises AI through semiconductors to build data centres , providing power, cooling, networking, storage, electrical equipment and materials.
- Phase 3 – New AI revenues: commercialises AI through software, cybersecu- rity, data platforms , consulting, agents, copilots and usage -based revenue streams.
- Phase 4 - Enhanced productivity : captures the broader diffusion of AI across the economy, where companies use AI internally to reduce costs, automate work- flows and improve margins. The investment implication is that profit visibility declines, but breadth increases as the theme moves through the phases. Phase 1 has the clearest earnings signal; Phase 2 has the strongest capex linkage; Phase 3 depends on proven monetisation and pric- ing power; Phase 4 is broader, as productivity gains propagate . Our eligible universe comprises US liquid listed companies meeting a minimum mar- ket-capitalisation of $1 billion . Companies are selected on a combination of metrics: exposure to AI -related revenues, infrastructure investment, products or potential oper- ating -efficiency gains. Phase 1 groups the Magnificent 7 based on scale, first -mover advantage and market leadership, while subsequent phases classify companies ac- cording to their dominant expected source of AI -related value creation. The baskets are equally weighted. Valuation indicators are based on median company -level multiples (i.e. PE, using 12 -month forward consensus earnings) . 4.1 Phase 1 – Precursors : Magnificent 7 Phase 1 is best described as “NVIDIA first, Magnificent 7 second”. NVIDIA has been the most visible earnings beneficiary of generative AI demand, while the rest of the Magnificent 7 provide the cloud platforms, data, distribution, user reach and capex ca- pacity needed to scale AI. The strong performance of NVIDIA and the Magnificent 7 has largely been earnings driven . Nevertheless, their forward PE ratio has fallen materially from earlier peaks of 37x to 24x PE 12 -month forward (vs. 27 x its average since 1995) suggesting that in- vestors already expect profit growth to normalise over time while financing risks are Capturing the AI oppor- tunity requires expo- sure beyond the Mag- nificent 7 and across the full value chain
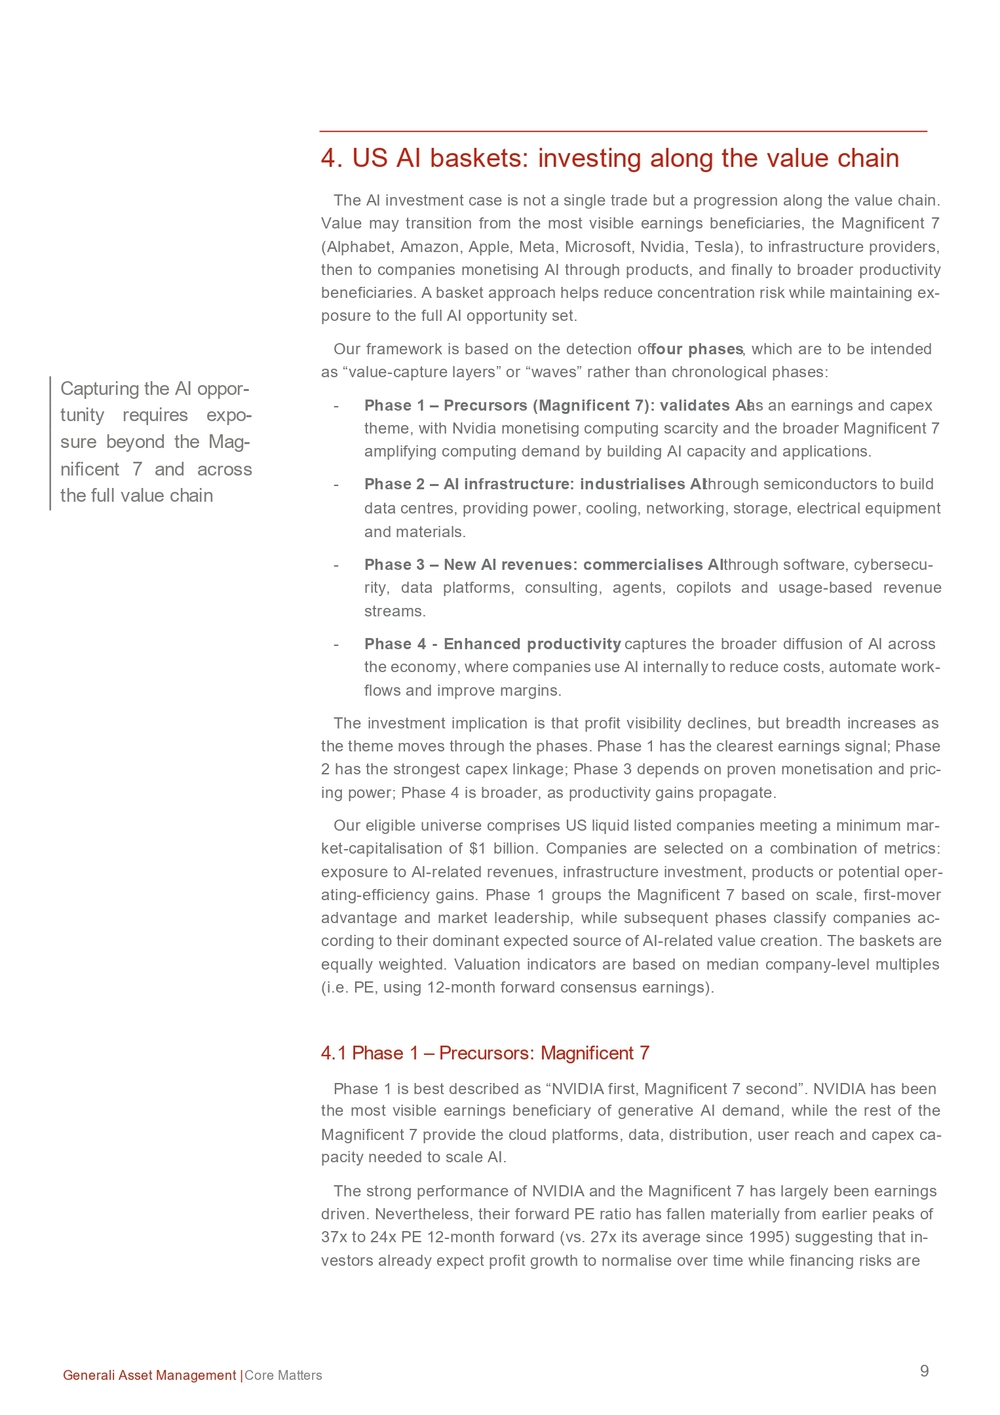
10 Generali Asset Management | Core Matters increasing. Similarly, currently, Mag. 7 relative price versus the S&P 500 is well below its relative earnings trend . 4.2 Phase 2 - AI infrastructure: the industrialisation of AI – 94 stocks Phase 2 captures the “picks -and-shovels” of AI. It includes 94 companies enabling the physical and digital build -out required to train, deploy and scale AI through data centres: semiconductors, power, cooling, electrical equipment, networking, storage, servers and materials. This phase transforms AI from a software story into a full -fledged capex supercycle , where by soaring demand creates scarcity and bottlenecks: chips and memory con- strain training and inference; networking becomes critical as scale increases. The key risk is that infrastructure capex runs out of steam if hyperscalers struggle to monetise the giant investments . 4.2.1 Cooling: the hottest bottleneck in AI infrastructure – 10 stocks Cooling is becoming one of the most important constraints in AI infrastructure , although water scarcity was already a challenge before the rise of AI and is largely driven by climate change. As AI workloads become more compute -intensive, power consumption
100120140160180200220240260280300320 2018 2019 2020 2021 2022 2023 2024 2025 2026 S&P AI stocks / SPX - Price S&P AI stocks / SPX - EarningsS&P 500: Mag. 7 vs SPX, eps vs price Source: Datastream, GenAMMag. 7 include NVIDIA, Apple, Meta, Alphabet, Tesla, Amazon and MicrosoftMag. 7 relative price still below vs. SPX relative eps trend 0510152025303540 2013 2014 2015 2016 2017 2018 2019 2020 2021 2022 2023 2024 2025 2026Mag. 7 12m fwd PE SPX 12m fwd PE Source: Datastream, GenAMS&P 500 & Mag. 7: 12m fwd PE $5,980 bn$1,994 bn$1,485 bn$712 bn$570 bn$277 bn $290 bn Semis, 24 Co's Hardware, 24 Co's Industrials, 18 Co's Utilities, 14 Co's Software, 3 Co's Materials, 4 Co's Others*, 7 Co'sPhase 2 -Infrastructure: Market Cap by Sector Source: Datastream, GenAM* Others include Energy, Financials, Real Estate 50150250350450550650 01/21 07/21 01/22 07/22 01/23 07/23 01/24 07/24 01/25 07/25 01/26 07/26 Phase 2 - Infrastructure S&P 500Phase 2 -Infrastructure vs. S&P 500 -Price Source: Datastream, GenAM
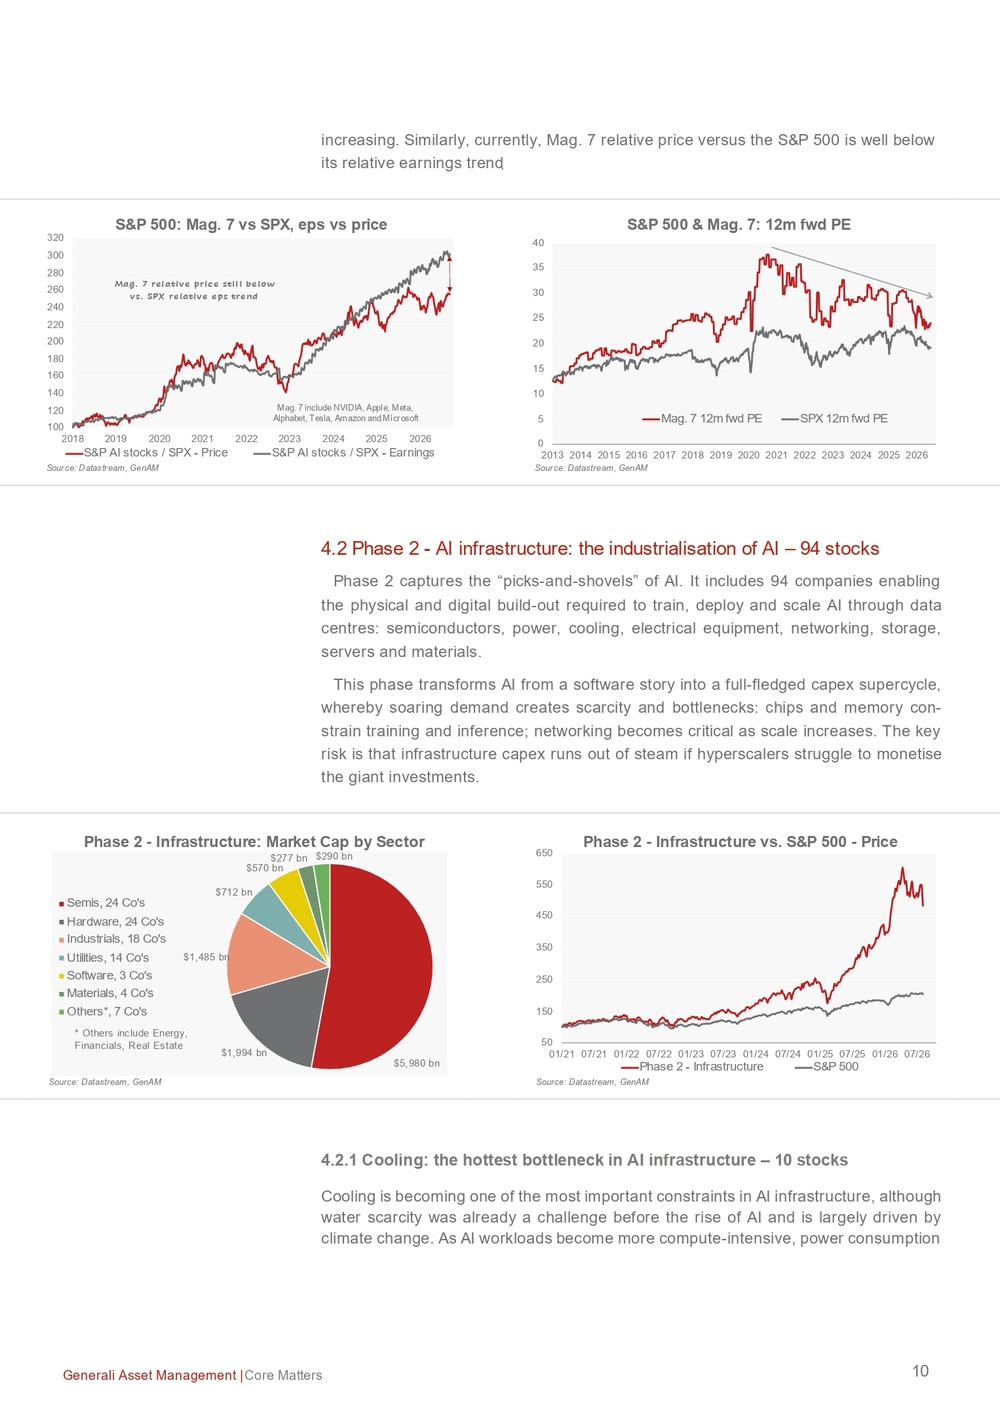
11 Generali Asset Management | Core Matters and heat density per rack are rising sharply, making conventional air cooling increas- ingly inadequate for advanced AI data centres. This creates a structural opportunity for liquid cooling, immersion cooling, precision heating, ventilation and air cond itioning (HVAC ), heat exchangers and thermal -man- agement systems. Cooling is also a reminder that many AI beneficiaries sit outside traditional technology sectors. Industrial companies with expertise in climate control, heat transfer and energy management are increasingly becoming critical enablers of AI adoption. Our Phase 2b basket includes 10 companies most of which operate in the capital goods sector . 4.3 Phase 3 - New revenues from AI: turning AI into products – 39 stocks Phase 3 shifts the focus from building AI infrastructure to monetising AI through prod- ucts and services. Our basket includes 39 firms , mostly in the software space. They seek to embed AI into new software, cybersecurity, data platforms, consulting, agents and workflow tools, turning AI into recurring revenues. They offer tools enabling others to utilize AI, while demonstrating AI product packaging capability, recurring revenue uplift, platform expansion, proprietary data advantages and potential margin benefits. The key risk is disruption: software and IT services firms face competition from model providers and AI -native challengers. At present it is hard to d istinguish companies that can charge for AI from those that must provide AI simply to defend existing revenues.
$252 bn$122 bn$102 bn$80 bn$21 bn Building Products, 5 Co's Machinery, 1 Co's Electrical Equip., 2 Co's Chemicals, 1 Co's Hardware, 1 Co'sPhase 2b -Cooling: Market Cap by Sector Source: Datastream, GenAM 50150250350450550650750 01/21 07/21 01/22 07/22 01/23 07/23 01/24 07/24 01/25 07/25 01/26 07/26 Phase 2b - Cooling S&P 500Phase 2b -Cooling vs. S&P 500 -Price Source: Datastream, GenAM $1,966 bn$682 bn$82 bn$68 bn Software, 23 Co's IT Services, 9 Co's Media, 1 Co's Others*, 6 Co'sPhase 3 -New Revenues: Market Cap by Sector Source: Datastream, GenAM* Others include Commercial & Prof. Svs, Hardware, Auto 507090110130150170190210230 01/21 07/21 01/22 07/22 01/23 07/23 01/24 07/24 01/25 07/25 01/26 07/26 Phase 3 - New Revenues S&P 500Phase 3 -New Revenues vs. S&P 500 -Price Source: Datastream, GenAM
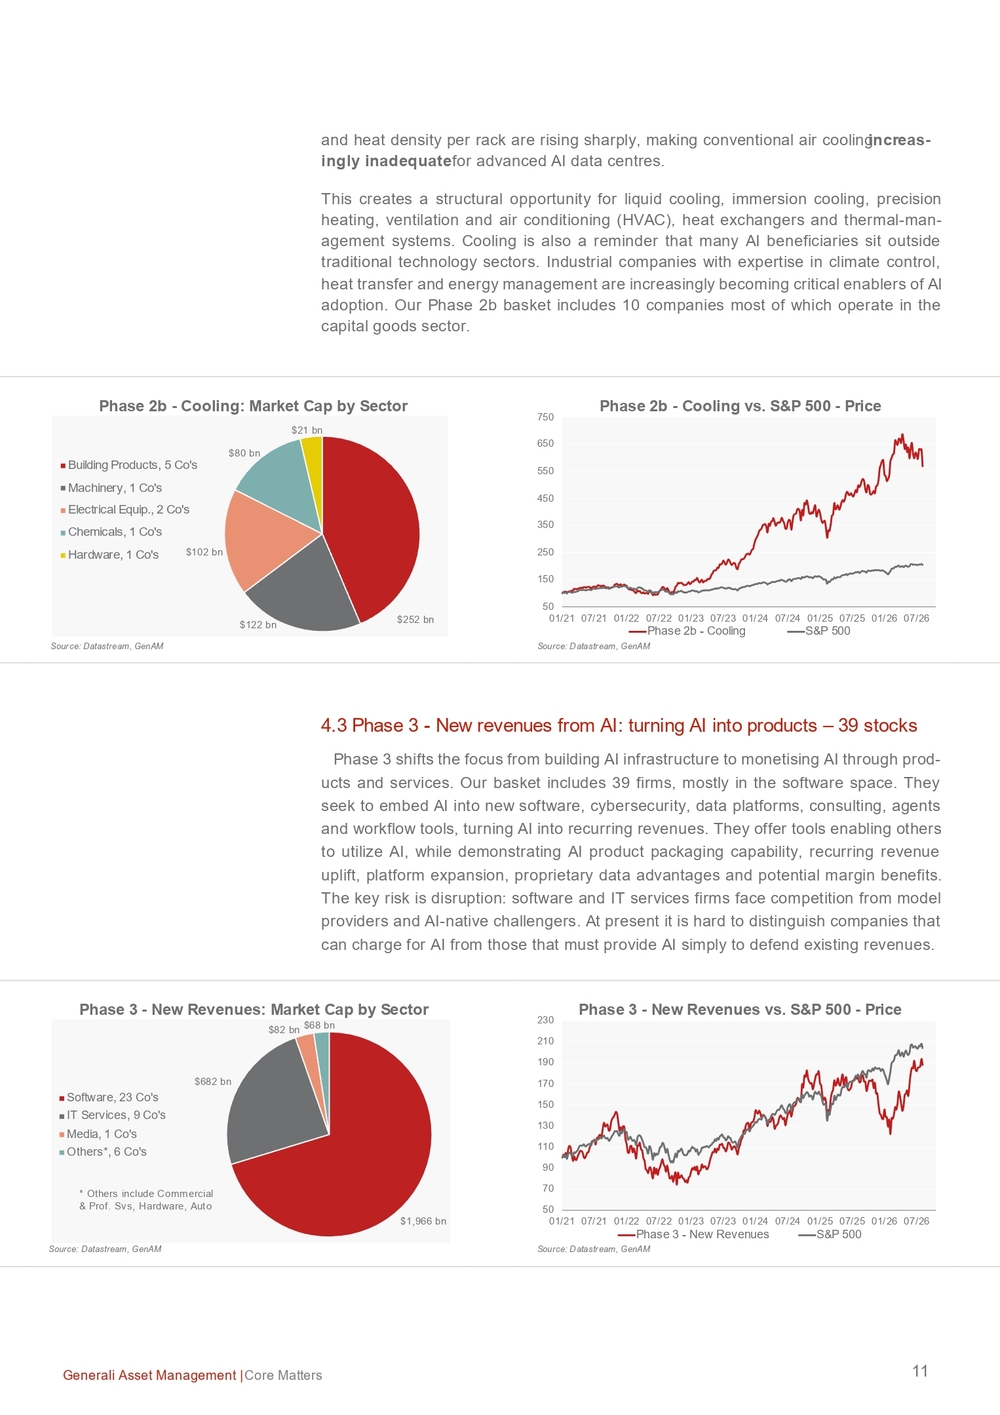
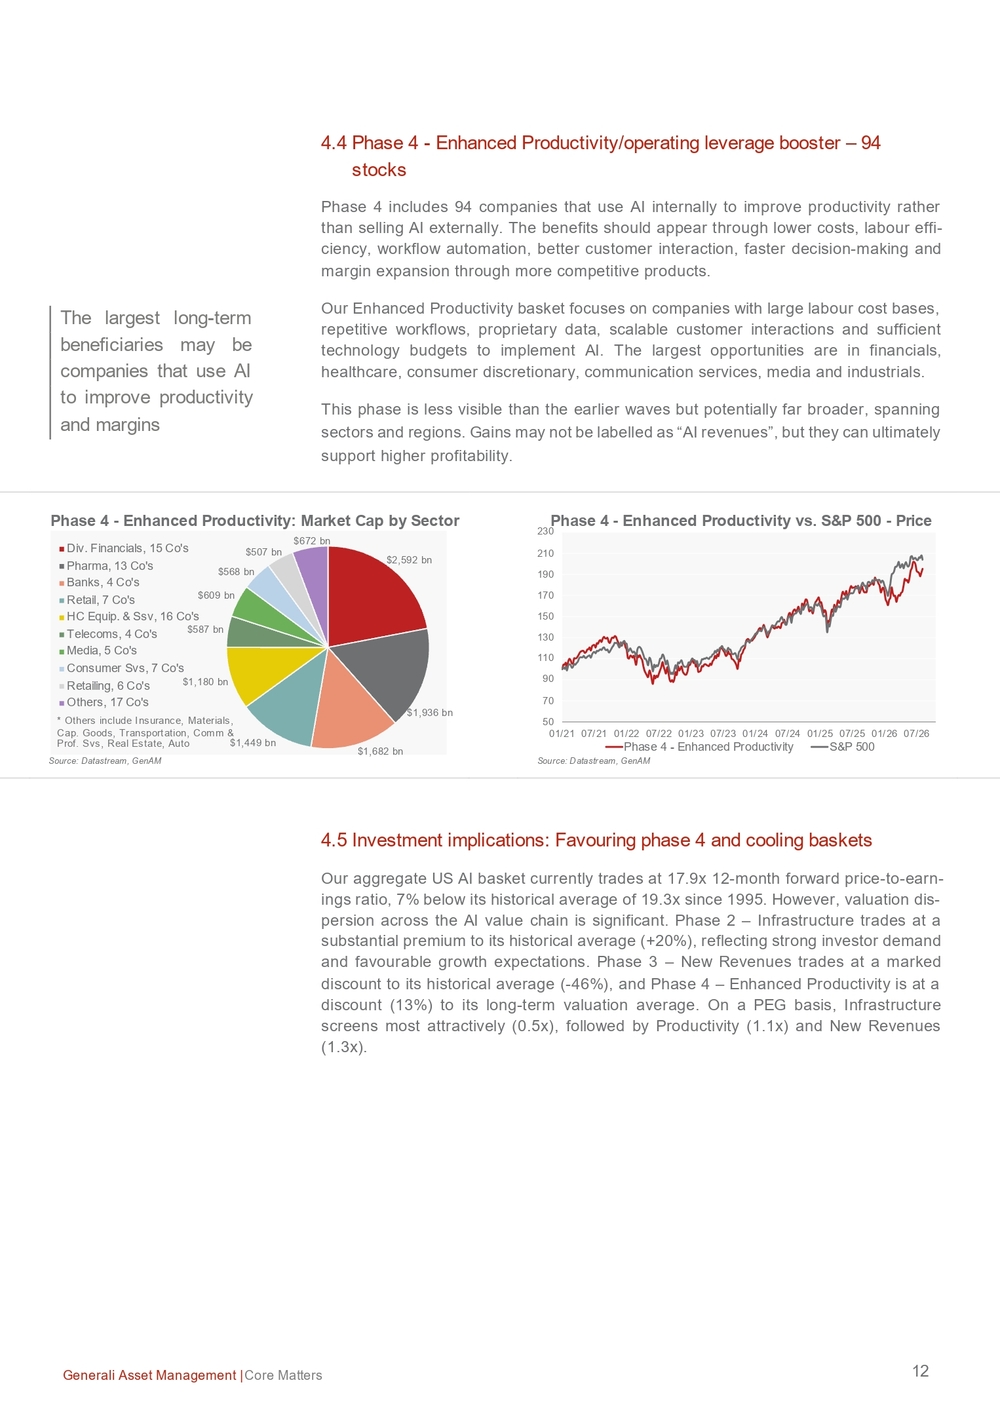
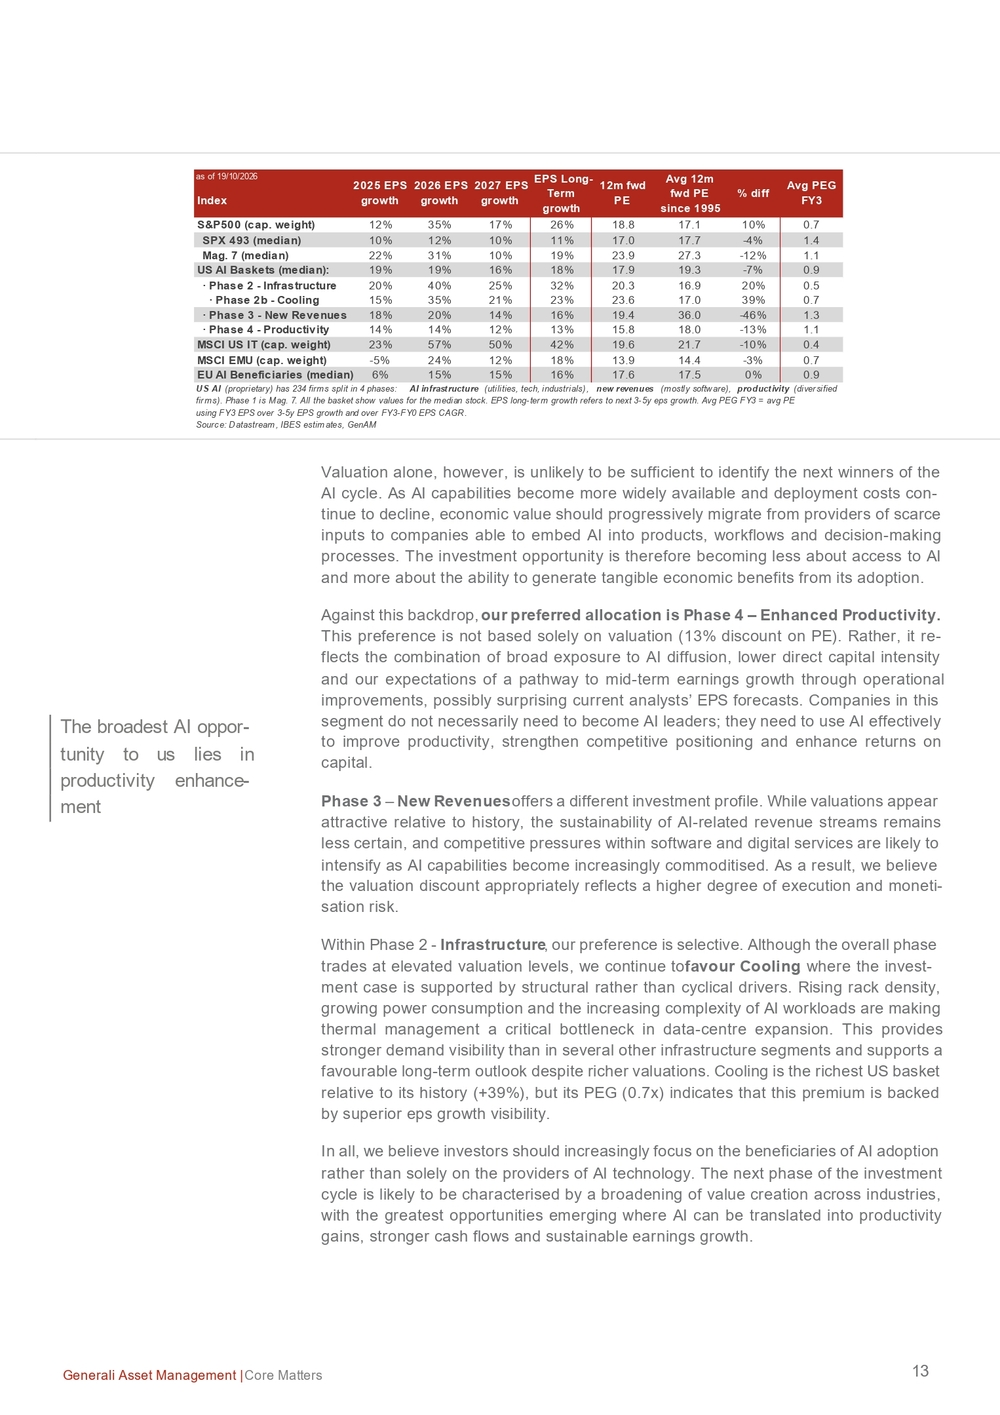
12 Generali Asset Management | Core Matters 4.4 Phase 4 - Enhanced Productivity /operating leverage booster – 94 stocks Phase 4 includes 94 companies that use AI internally to improve productivity rather than selling AI externally. The benefits should appear through lower costs, labour effi- ciency, workflow automation, better customer interaction, faster decision -making and margin expansion th rough more competitive products. Our Enhanced Productivity basket focuses on companies with large labour cost bases, repetitive workflows, proprietary data, scalable customer interactions and sufficient technology budgets to implement AI. The largest opportunities are in financials, healt hcare, consumer discretionary, communication services, media and industrials. This phase is less visible than the earlier waves but potentially far broader, spanning sectors and regions . Gains may not be labelled as “AI revenues”, but they can ultimately support higher profitability. 4.5 Investment implications : Favouring phase 4 and cooling baskets Our aggregate US AI basket currently trades at 17.9x 12-month forward price -to-earn- ings ratio , 7% below its historical average of 19. 3x since 1995 . However, valuation dis- persion across the AI value chain is significant. Phase 2 – Infrastructure trades at a substantial premium to its historical average (+20%) , reflecting strong investor demand and favourable growth expectations. Phase 3 – New Revenues trades at a marked discount to its historical average (-46%) , and Phase 4 – Enhanced Productivity is at a discount (13%) to its long -term valuation avera ge. On a PEG basis, Infrastructure screens most attractively (0.5x) , followed by Productivity (1.1x) and New Revenues (1.3x) .
$2,592 bn $1,936 bn $1,682 bn$1,449 bn$1,180 bn$587 bn$609 bn$568 bn$507 bn$672 bnDiv. Financials, 15 Co's Pharma, 13 Co's Banks, 4 Co's Retail, 7 Co's HC Equip. & Ssv, 16 Co's Telecoms, 4 Co's Media, 5 Co's Consumer Svs, 7 Co's Retailing, 6 Co's Others, 17 Co'sPhase 4 -Enhanced Productivity: Market Cap by Sector Source: Datastream, GenAM* Others include Insurance, Materials, Cap. Goods, Transportation, Comm & Prof. Svs, Real Estate, Auto 507090110130150170190210230 01/21 07/21 01/22 07/22 01/23 07/23 01/24 07/24 01/25 07/25 01/26 07/26 Phase 4 - Enhanced Productivity S&P 500Phase 4 -Enhanced Productivity vs. S&P 500 -Price Source: Datastream, GenAMThe largest long -term beneficiaries may be companies that use AI to improve productivity and margins
13 Generali Asset Management | Core Matters Valuation alone, however, is unlikely to be sufficient to identify the next winners of the AI cycle. As AI capabilities become more widely available and deployment costs con- tinue to decline, economic value should progressively migrate from providers of scarce inputs to companies able to embed AI into products, wo rkflows and decision -making processes. The investment opportunity is therefore becoming less about access to AI and more about the ability to generate tangible economic benefits from its adoption. Against this backdrop, our preferred allocation is Phase 4 – Enhanced Productivity. This preference is not based solely on valuation (13% discount on PE) . Rather, it re- flects the combination of broad exposure to AI diffusion, lower direct capital intensity and our expectations of a pathway to mid-term earnings growth through operational improvements , possibly surprising current analysts’ EPS forecasts . Companies in this segment do not necessarily need to become AI leaders; they need to use AI effectively to improve productivity, strengthen competitive positioning and enhance returns on capital. Phase 3 – New Revenues offers a different investment profile. While valuations appear attractive relative to history, the sustainability of AI -related revenue streams remains less certain, and competitive pressures within software and digital services are likely to intensify as AI capabilities become increasingly commoditised. As a result, we believe the valuation discount appropriately reflects a higher degree of execution and moneti- sation risk. Within Phase 2 - Infrastructure , our preference is selective. Although the overall phase trades at elevated valuation levels, we continue to favour Cooling , where the invest- ment case is supported by structural rather than cyclical drivers. Rising rack density, growing power consumption and the increasing complexity of AI workloads are making thermal management a critical bottleneck in data -centre expansion. This provides stronger demand visibility than in several other infrastructure segments and supports a favourable long -term outlook despite richer valuations. Cooling is the richest US basket relative to its history (+ 39%), but its PEG (0. 7x) indicates that this premium is backed by superior eps growth visibility. In all , we believe investors should increasingly focus on the beneficiaries of AI adoption rather than solely on the providers of AI technology. The next phase of the investment cycle is likely to be characterised by a broadening of value creation across industr ies, with the greatest opportunities emerging where AI can be translated into productivity gains, stronger cash flows and sustainable earnings growth.
as of 19/10/2026 Index S&P500 (cap. weight) 12% 35% 17% 26% 18.8 17.1 10% 0.7 SPX 493 (median) 10% 12% 10% 11% 17.0 17.7 -4% 1.4 Mag. 7 (median) 22% 31% 10% 19% 23.9 27.3 -12% 1.1 US AI Baskets (median): 19% 19% 16% 18% 17.9 19.3 -7% 0.9 · Phase 2 - Infrastructure 20% 40% 25% 32% 20.3 16.9 20% 0.5 · Phase 2b - Cooling 15% 35% 21% 23% 23.6 17.0 39% 0.7 · Phase 3 - New Revenues 18% 20% 14% 16% 19.4 36.0 -46% 1.3 · Phase 4 - Productivity 14% 14% 12% 13% 15.8 18.0 -13% 1.1 MSCI US IT (cap. weight) 23% 57% 50% 42% 19.6 21.7 -10% 0.4 MSCI EMU (cap. weight) -5% 24% 12% 18% 13.9 14.4 -3% 0.7 EU AI Beneficiaries (median) 6% 15% 15% 16% 17.6 17.5 0% 0.9 US AI (proprietary) has 234 firms split in 4 phases: AI infrastructure (utilities, tech, industrials), new revenues (mostly software), productivity (diversified firms). Phase 1 is Mag. 7. All the basket show values for the median stock. EPS long-term growth refers to next 3-5y eps growth. Avg PEG FY3 = avg PE using FY3 EPS over 3-5y EPS growth and over FY3-FY0 EPS CAGR. Source: Datastream, IBES estimates, GenAM2025 EPS growth2026 EPS growth2027 EPS growthEPS Long- Term growth12m fwd PEAvg 12m fwd PE since 1995% diffAvg PEG FY3 The broadest AI oppor- tunity to us lies in productivity enhance- ment
14 Generali Asset Management | Core Matters 5. Conclusions : from building to adopting AI The AI investment cycle is entering a new phase. While the first wave of returns ac- crued primarily to providers of compute, infrastructure and foundation models, the next wave is likely to be driven by adoption and value creation . As AI capabilities become more widely available, the key investment question is shifting from building to adopt- ing AI. In the US , we maintain a preference for Phase 4 – Enhanced Productivity , where AI adoption has the potential to support earnings growth, margin expansion and higher returns on capital across a broad set of companies. We complement this exposure with selective investments in Cooling , a critical infrastructure bottleneck where structural demand remains supported by rising data -centre density and power requirements. As the technology diffuses across industries and geographies, leadership is likely to broaden from AI builders to AI adopters. In our view, the next phase of the AI investment cycle will be driven less by access to compute and more by the ability to conver t AI capabilities into productivity gains, cash -flow growth and sustainable economic value.
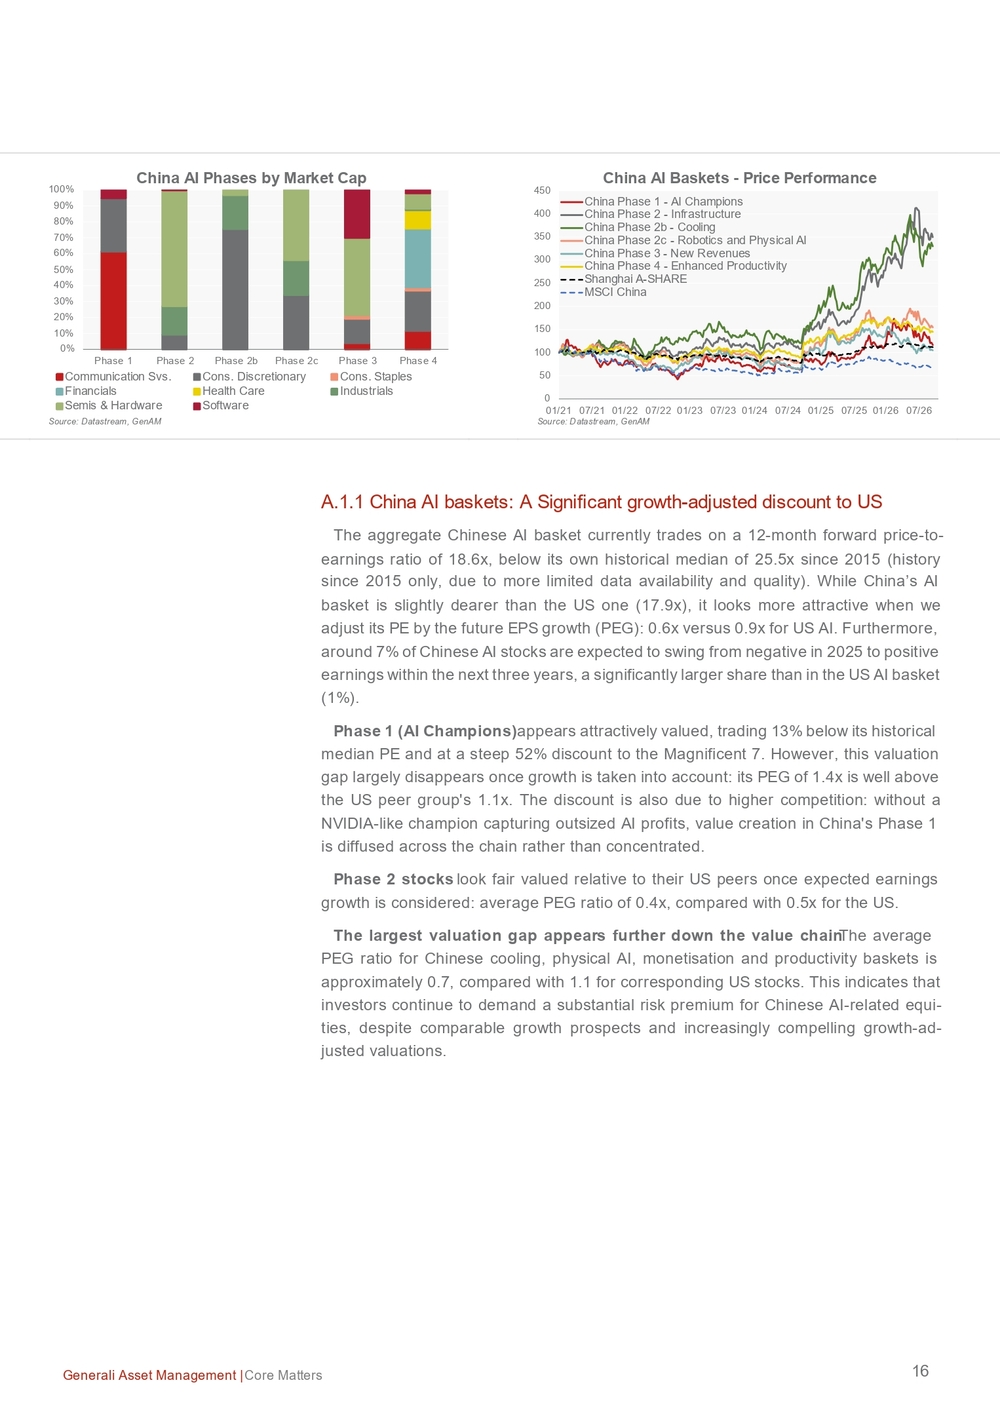
15 Generali Asset Management | Core Matters Appendix A.1: China AI - exposure at a discount The AI ecosystem is global, highly fragmented and increasingly diversified across regions. Concentrating AI exposure solely in US equities risks overlooking relevant pieces of the global supply chain and sources of innovation. Geographical diversifica- tion is also important because of the increasing concentration risk within US equity markets , with big tech firms representing nearly 40% of the S&P 500 index. Addition- ally, parts of the non -US AI universe offer exposure to similar structural growth themes at substantially lower valuations. China is developing an AI ecosystem with different strengths, opportunities and risks. While the US remains the global leader in frontier models, cloud computing and AI monetisation, China has emerged as a major force in AI infrastructure, power equip- ment and batteries, as well as industrial automation and selected AI applications. Following the same logic as our US AI framework, we identify four phases, whose relative importance differs however significantly. Phase 1 – AI Champions - Foundation Models and AI Platforms (9 stocks): value creation within China's AI ecosystem is more dispersed across model developers, cloud providers and infrastructure companies. Competition is intense, barriers to entry are lower, and the rapid proliferation of open -source models has further accelerat ed com- moditisation. China's first AI wave therefore resembles less a winner -takes -all oppor- tunity and more a diversified exposure to the country's evolving AI ecosystem. Phase 2 – AI Infrastructure - Industrialising AI (107 stocks): whereas the US in- frastructure story is largely driven by spending decisions of a small group of hyperscal- ers, China's infrastructure build -out is more fragmented, reflecting China's strengths in industrial production and engineering. Infrastructure occupies a larger role in the Chinese value chain than it does in the United States . Phase 2B – Cooling (10 stocks) follows the same logic as US Phase 2b. Phase 2C – Robotics and Physical AI - Bringing AI into the Real Economy (17 stocks): China's AI ecosystem extends beyond data centres and software/IT services, to include robotics and intelligent automation. This segment focuses on applying AI in factories, warehouses, logistics networks and industrial processes. China's large man- ufacturi ng base, extensive automation capabilities and leadership in industrial robot deployment provide a natural advantage in this area. The latest International Federa- tion of Robotics data confirm that China’s lead continues to widen: it installed 354,200 industrial robots in 2025, accounting for 59% of global deployments and exceeding US installations by more than ninefold. Phase 3 – AI Monetisation - Turning AI Into Revenues (27 stocks): monetisation dynamics in China remain more challenging. Competition is fierce, open -source adop- tion is widespread, and pricing power is generally weaker. The risk is that AI becomes a basic requirement rather than a paid service, compressing margins rathe r than ex- panding them. Phase 4 – Enhanced Productivity (35 stocks) follows the same logic as for the US. China combines a large AI market with improv- ing technological com- petitiveness. It offers AI exposure at a valuation discount
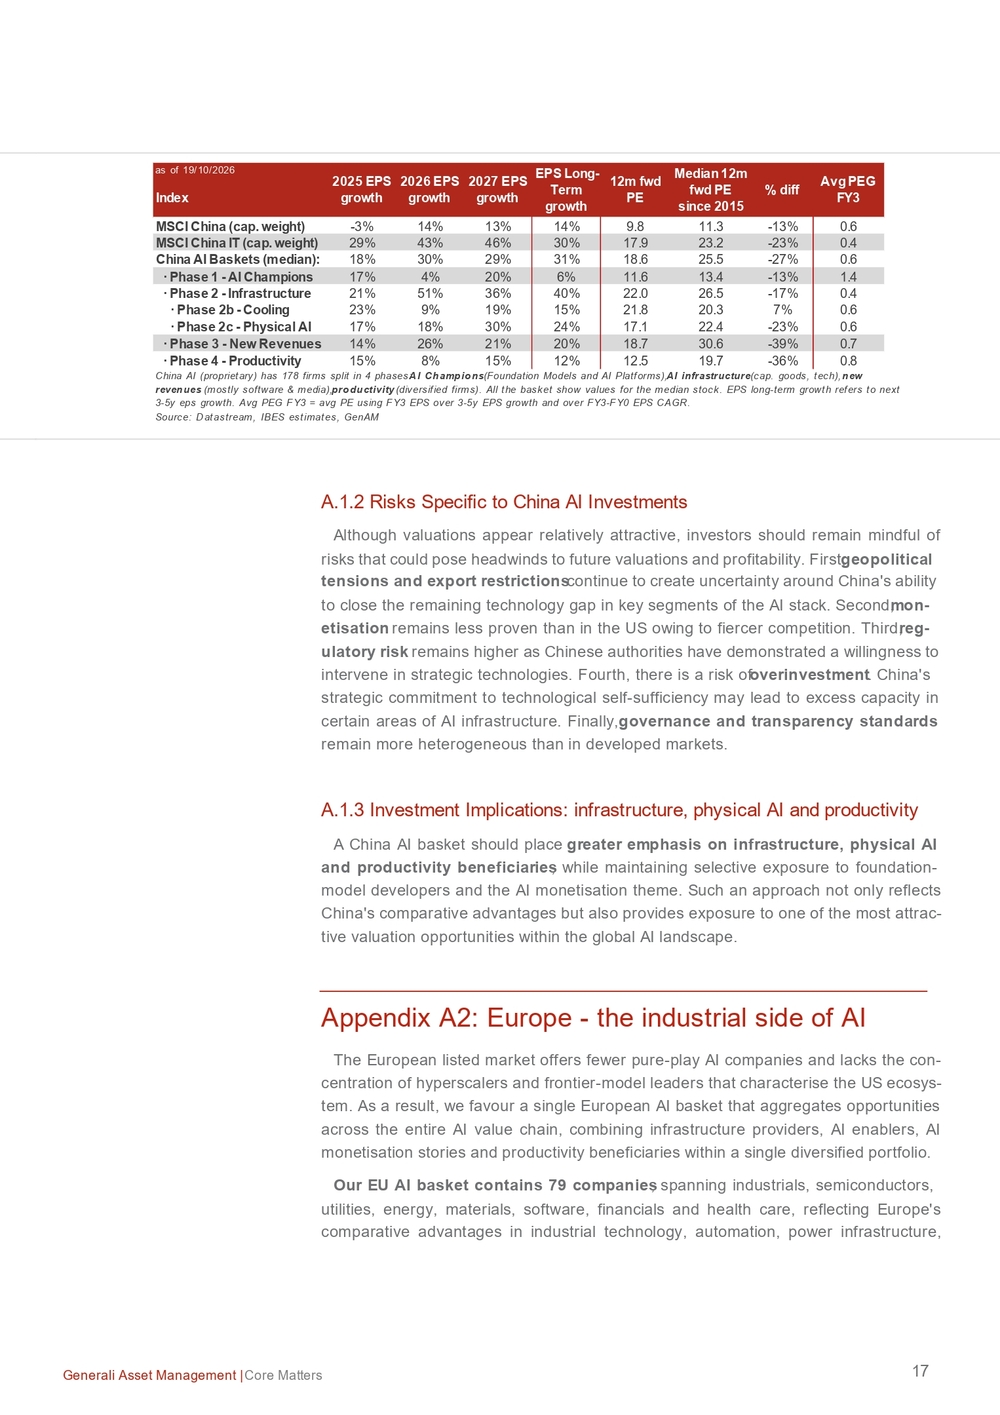
16 Generali Asset Management | Core Matters A.1.1 China AI baskets: A Significant growth -adjusted discount to US The aggregate Chinese AI basket currently trades on a 12 -month forward price -to- earnings ratio of 18.6x , below its own historical median of 25.5x since 2015 (history since 2015 only, due to more limited data availability and quality). While China’s AI basket is slightly dearer than the US one ( 17.9x), it looks more attractive when we adjust its PE by the future EPS growth (PEG): 0.6x versus 0.9x for US AI. Furthermore, around 7% of Chinese AI stocks are expected to swing from negative in 2025 to positive earnings within the next three years, a signi ficantly larger share than in the US AI basket (1%). Phase 1 (AI Champions) appears attractively valued, trading 13% below its historical median PE and at a steep 52% discount to the Magnificent 7. However, this valuation gap largely disappears once growth is taken into account: its PEG of 1. 4x is well above the US peer group's 1. 1x. The discount is also due to higher competition: without a NVIDIA -like champion capturing outsized AI profits, value creation in China's Phase 1 is diffused across the chain rather than concentrated. Phase 2 stocks look fair valued relative to their US peers once expected earnings growth is considered: average PEG ratio of 0. 4x, compared with 0. 5x for the US. The largest valuation gap appears further down the value chain . The average PEG ratio for Chinese cooling, physical AI, monetisation and productivity baskets is approximately 0.7, compared with 1 .1 for corresponding US stocks. This indicates that investors continue to demand a substantial risk premium for Chinese AI -related equi- ties, despite comparable growth prospects and increasingly compelling growth -ad- justed valuations.
0%10%20%30%40%50%60%70%80%90%100% Phase 1 Phase 2 Phase 2b Phase 2c Phase 3 Phase 4 Communication Svs. Cons. Discretionary Cons. Staples Financials Health Care Industrials Semis & Hardware SoftwareChina AI Phases by Market Cap Source: Datastream, GenAM 050100150200250300350400450 01/21 07/21 01/22 07/22 01/23 07/23 01/24 07/24 01/25 07/25 01/26 07/26China Phase 1 - AI Champions China Phase 2 - Infrastructure China Phase 2b - Cooling China Phase 2c - Robotics and Physical AI China Phase 3 - New Revenues China Phase 4 - Enhanced Productivity Shanghai A-SHARE MSCI ChinaChina AI Baskets -Price Performance Source: Datastream, GenAM
17 Generali Asset Management | Core Matters A.1.2 Risks Specific to China AI Investments Although valuations appear relatively attractive, investors should remain mindful of risks that could pose headwinds to future valuations and profitability. First, geopolitical tensions and export restrictions continue to create uncertainty around China's ability to close the remaining technology gap in key segments of the AI stack. Second, mon- etisation remains less proven than in the US owing to fiercer competition. Third, reg- ulatory risk remains higher as Chinese authorities have demonstrated a willingness to intervene in strategic technologies. Fourth, there is a risk of overinvestment . China's strategic commitment to technological self -sufficiency may lead to excess capacity in certain areas of AI infrastructure. Finally, governance and transparency standards remain more heterogeneous than in developed markets. A.1.3 Investment Implications: infrastructure, physical AI and productivity A China AI basket should place greater emphasis on infrastructure, physical AI and productivity beneficiaries , while maintaining selective exposure to foundation - model developers and the AI monetisation theme. Such an approach not only reflects China's comparative advantages but also provides exposure to one of the most attrac- tive valuation opportunities within t he global AI landscape. Appendix A2: Europe - the industrial side of AI The European listed market offers fewer pure -play AI companies and lacks the con- centration of hyperscalers and frontier -model leaders that characterise the US ecosys- tem. As a result, we favour a single European AI basket that aggregates opportunities acros s the entire AI value chain, combining infrastructure providers, AI enablers, AI monetisation stories and productivity beneficiaries within a single diversified portfolio. Our EU AI basket contains 79 companies , spanning industrials, semiconductors, utilities, energy, materials, software, financials and health care, reflecting Europe's comparative advantages in industrial technology, automation, power infrastructure,
as of 19/10/2026 Index MSCI China (cap. weight) -3% 14% 13% 14% 9.8 11.3 -13% 0.6 MSCI China IT (cap. weight) 29% 43% 46% 30% 17.9 23.2 -23% 0.4 China AI Baskets (median): 18% 30% 29% 31% 18.6 25.5 -27% 0.6 · Phase 1 - AI Champions 17% 4% 20% 6% 11.6 13.4 -13% 1.4 · Phase 2 - Infrastructure 21% 51% 36% 40% 22.0 26.5 -17% 0.4 · Phase 2b - Cooling 23% 9% 19% 15% 21.8 20.3 7% 0.6 · Phase 2c - Physical AI 17% 18% 30% 24% 17.1 22.4 -23% 0.6 · Phase 3 - New Revenues 14% 26% 21% 20% 18.7 30.6 -39% 0.7 · Phase 4 - Productivity 15% 8% 15% 12% 12.5 19.7 -36% 0.8Median 12m fwd PE since 2015% diffAvg PEG FY3 China AI (proprietary) has 178 firms split in 4 phases: AI Champions (Foundation Models and AI Platforms), AI infrastructure (cap. goods, tech), new revenues (mostly software & media), productivity (diversified firms). All the basket show values for the median stock. EPS long-term growth refers to next 3-5y eps growth. Avg PEG FY3 = avg PE using FY3 EPS over 3-5y EPS growth and over FY3-FY0 EPS CAGR. Source: Datastream, IBES estimates, GenAM2025 EPS growth2026 EPS growth2027 EPS growthEPS Long- Term growth12m fwd PE
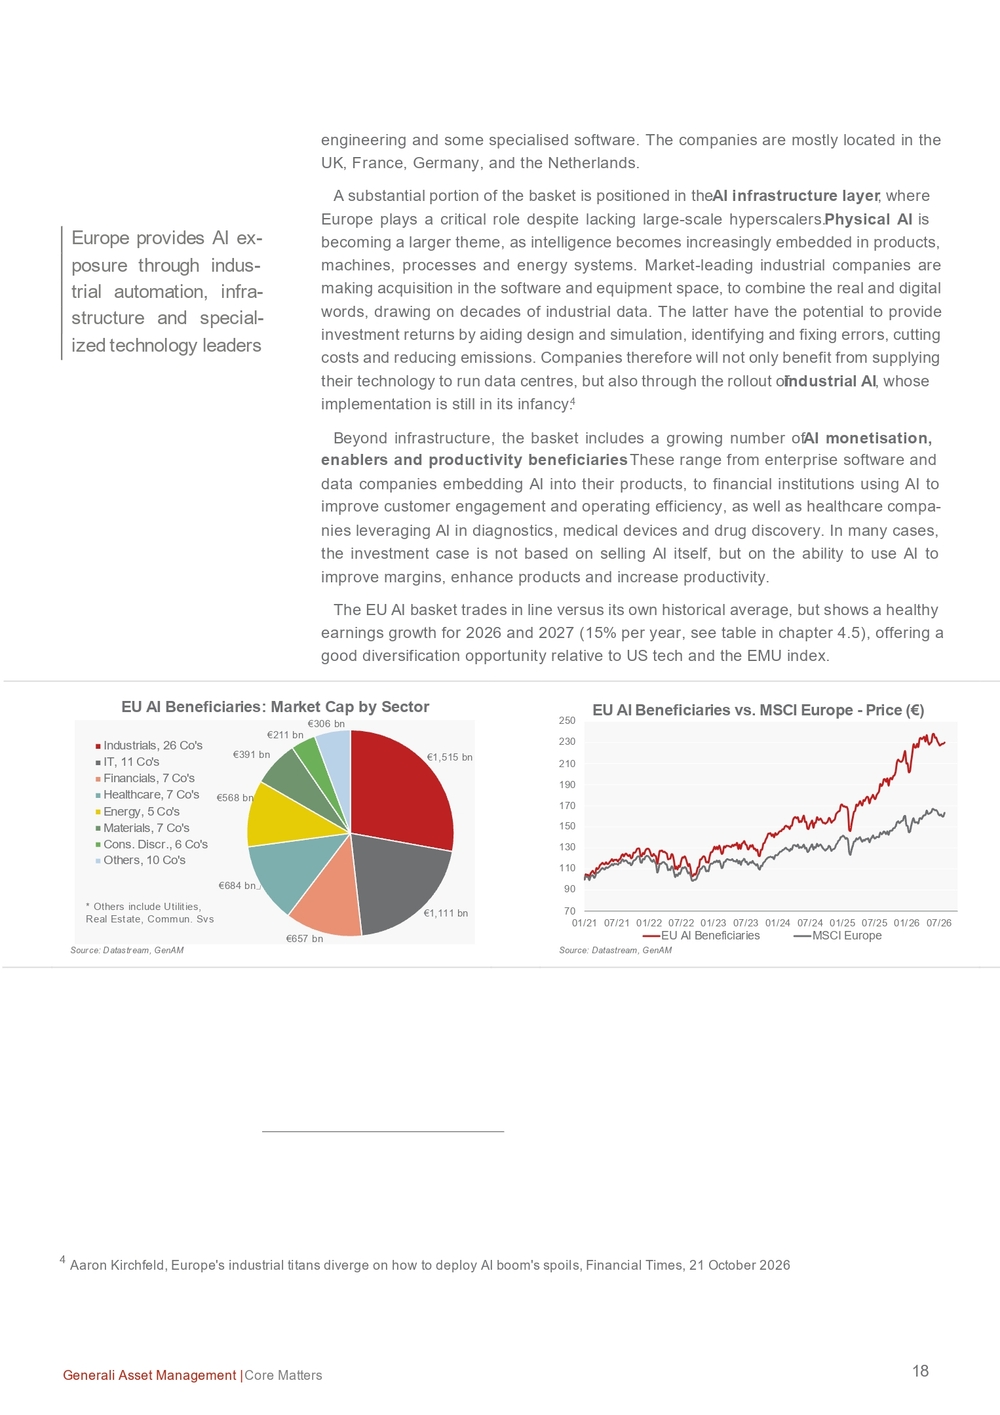
18 Generali Asset Management | Core Matters engineering and some specialised software. The companies are mostly located in the UK, France, Germany, and the Netherlands. A substantial portion of the basket is positioned in the AI infrastructure layer , where Europe plays a critical role despite lacking large -scale hyperscalers. Physical AI is becoming a larger theme, as intelligence becomes increasingly embedded in products, machines, processes and energy systems. Market -leading industrial companies are making acquisition in the software and equipment space, to combine the real and digital words, drawing on decades of industrial data. The latter have the potential to provide investment returns by aiding design and simulation, identifying and fixing errors, cutting costs and reducing emissions. Companies therefore will not only benefit from s upplying their technology to run data centres, but also through the rollout of industrial AI , whose implementation is still in its infancy.4 Beyond infrastructure, the basket includes a growing number of AI monetisation, enablers and productivity beneficiaries . These range from enterprise software and data companies embedding AI into their products, to financial institutions using AI to improve customer engagement and operating efficiency, as well as healthcare compa- nies leveraging AI in diagnostics, medical de vices and drug discovery. In many cases, the investment case is not based on selling AI itself, but on the ability to use AI to improve margins, enhance products and increase productivity. The EU AI basket trades in line versus its own historical average , but shows a healthy earnings growth for 2026 and 2027 (15% per year , see table in chapter 4.5 ), offering a good diversification opportunity relative to US tech and the EMU index .
4 Aaron Kirchfeld , Europe's industrial titans diverge on how to deploy AI boom's spoils , Financial Times, 2 1 October 2026
€1,515 bn €1,111 bn €657 bn€684 bn€568 bn€391 bn€211 bn€306 bn Industrials, 26 Co's IT, 11 Co's Financials, 7 Co's Healthcare, 7 Co's Energy, 5 Co's Materials, 7 Co's Cons. Discr., 6 Co's Others, 10 Co'sEU AI Beneficiaries : Market Cap by Sector Source: Datastream, GenAM* Others include Utilities, Real Estate, Commun. Svs 7090110130150170190210230250 01/21 07/21 01/22 07/22 01/23 07/23 01/24 07/24 01/25 07/25 01/26 07/26 EU AI Beneficiaries MSCI EuropeEU AI Beneficiaries vs. MSCI Europe -Price (€) Source: Datastream, GenAMEurope provides AI ex- posure through indus- trial automation, infra- structure and special- ized technology leaders
FOR PROFESSIONAL INVESTORS ONLY www.generali -am.com Part of This document is based on information and opinions which Generali Asset Management S.p.A. Società di gestione del risparmio has obtained from sources within and outside of the Generali Group. While such information is believed to be reliable for the purposes used herein, no representation or warranty, expressed or i mplied, is made that such information or opinions are accurate or com- plete. The information, opinions estimates and forecasts expressed in this document are as of the date of this publication an d represent only the judgment of Generali Asset Management S.p.A. Società di gestione del risparmio and may be subject to any change without notification. It shall not be considered as an explicit or implicit recommendation o f investment strategy or as investment advice. Before subscribing an offer of investment services, each potential client shall be given every document provided by the regulations in force from time to time, documents to be carefully read by the client before making any investment choice. Generali Asset Management S.p.A. Società di gestione del risparmio may have taken or, and may in the future take, investment decisions for the portfolios it manages which are contrary to the views expressed herein. Generali Asset Management S.p. A. Società di gestione del risparmio relieves itself from any responsibility concerning mis- takes or omissions and shall not be considered responsible in case of possible damages or losses related to the improper use of the information herein provided. It is recommended to look over the regul ation, available on our website. Generali Asset Management S.p. A. Società di gestione del risparmio is part of the Generali Group which was established in 1831 in Trieste as Assicurazioni Generali Austro Italiche. F O R P R OPart of IMPRINT Issued by Generali Asset Management S.p.A. Società di gestione del risparmio, Research Department Head of Research Vincent Chaigneau Head of Macro & Market Research Dr. Thomas Hempell, CFA
Team Elisabeth Assmuth | Research Operations Elisa Belgacem | Head of Cross -Asset Quant & Dev, Senior Credit Strategist Radomír Jáč | GI CEE Chief Economist Jakub Krátký | GI CEE Financial Analyst Michele Morganti | Head of Insurance & AM Research, Senior Equity Strategist Vladimir Oleinikov | Senior Quantitative Analyst Dr. Thorsten Runde | Senior Quantitative Analyst Dr. Christoph Siepmann | Senior Economist Dr. Florian Späte, CIIA | Senior Bond Strategist Guillaume Tresca | Senior Emerging Market Strategist Dr. Martin Wolburg, CIIA | Senior Economist Paolo Zanghieri, PhD | Senior Economist Head of Insurance and AM Research Michele Morganti Team Carlotta de Maria | Insurance Research Analyst Mattia Mammarella | Research Analyst Antonio Salera, PhD | Economist, Pension Expert Federica Tartara, CFA | Senior Economist
Head of Cross -Asset Quant&Development Elisa Belgacem Team Alexandre Boistard | Quantitative Research Analyst Marc Jeulin | Quantitative Research Analyst Mattia Mammarella | Research Analyst
Head of Credit Re- search Vivek Tawadey