GenAM_RS_5y returns 2026_fin
by Generali Investments
FOR PROFESSIONAL INVESTORS ONLY GenAM Macro & Market Research November 2026 The return of carry Our new 5 -year return forecasts

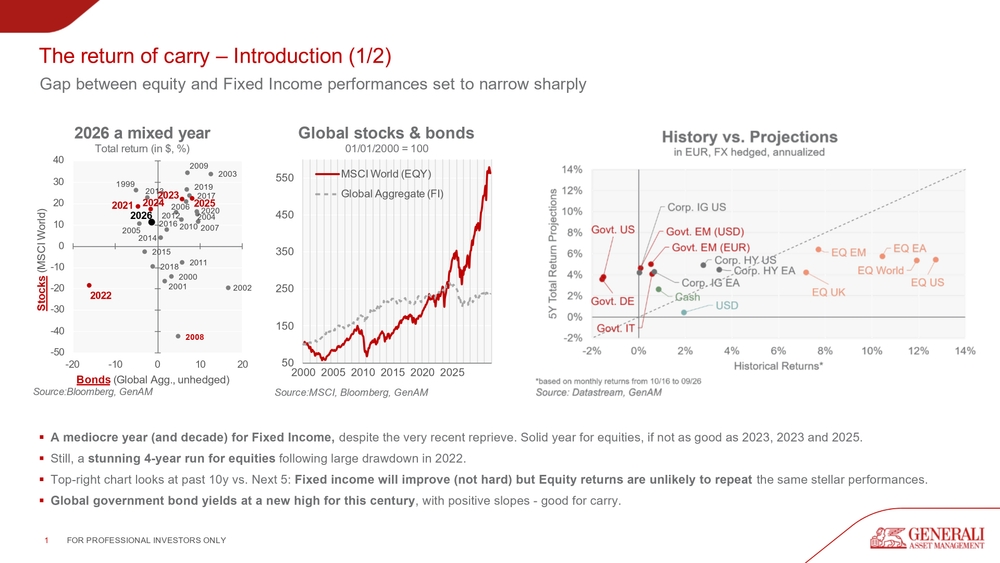
1 FOR PROFESSIONAL INVESTORS ONLY ▪ A mediocre year (and decade) for Fixed Income, despite the very recent reprieve. Solid year for equities, if not as good as 2023, 2023 and 2025. ▪ Still, a stunning 4-year run for equities following large drawdown in 2022. ▪ Top-right chart looks at past 10y vs. Next 5: Fixed income will improve (not hard) but Equity returns are unlikely to repeat the same stellar performances. ▪ Global government bond yields at a new high for this century, with positive slopes - good for carry. The return of carry – Introduction (1/2) Gap between equity and Fixed Income performances set to narrow sharply
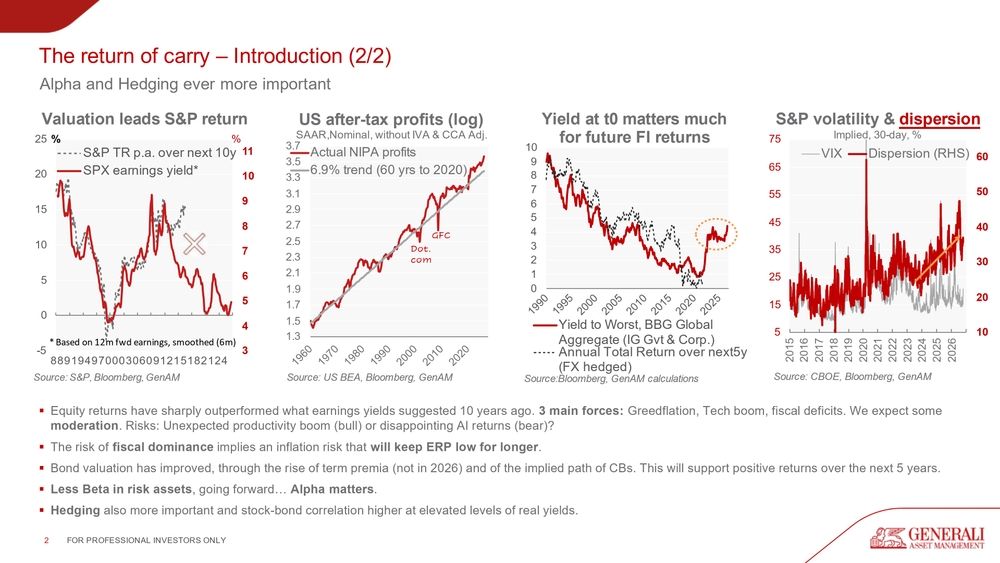
2 FOR PROFESSIONAL INVESTORS ONLY ▪ Equity returns have sharply outperformed what earnings yields suggested 10 years ago. 3 main forces: Greedflation, Tech boom, fiscal deficits. We expect some moderation. Risks: Unexpected productivity boom (bull) or disappointing AI returns (bear)? ▪ The risk of fiscal dominance implies an inflation risk that will keep ERP low for longer. ▪ Bond valuation has improved, through the rise of term premia (not in 2026) and of the implied path of CBs. This will support positive returns over the next 5 years. ▪ Less Beta in risk assets, going forward… Alpha matters. ▪ Hedging also more important and stock-bond correlation higher at elevated levels of real yields. The return of carry – Introduction (2/2) Alpha and Hedging ever more important
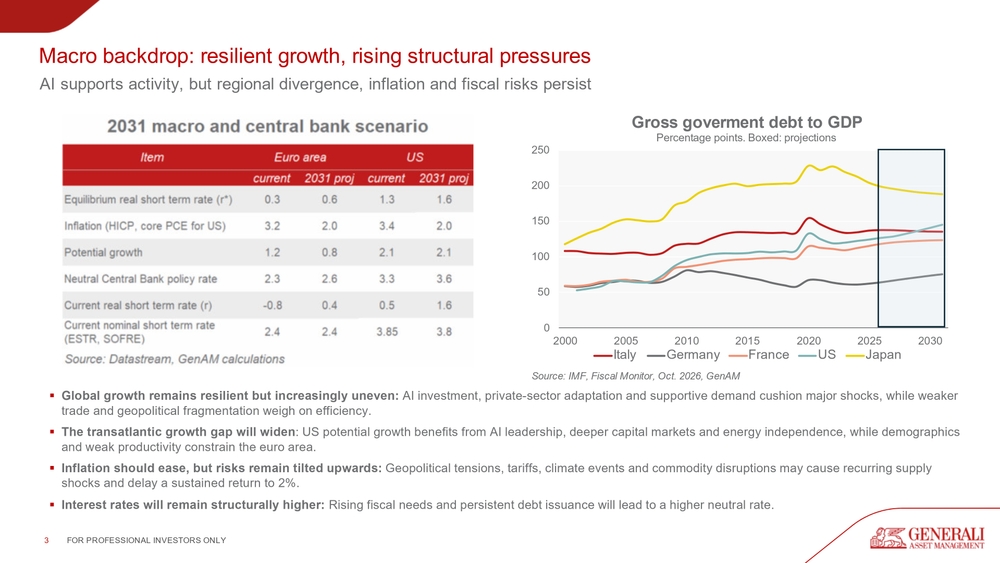
3 FOR PROFESSIONAL INVESTORS ONLY ▪ Global growth remains resilient but increasingly uneven: AI investment, private-sector adaptation and supportive demand cushion major shocks, while weaker trade and geopolitical fragmentation weigh on efficiency. ▪ The transatlantic growth gap will widen: US potential growth benefits from AI leadership, deeper capital markets and energy independence, while demographics and weak productivity constrain the euro area. ▪ Inflation should ease, but risks remain tilted upwards: Geopolitical tensions, tariffs, climate events and commodity disruptions may cause recurring supply shocks and delay a sustained return to 2%. ▪ Interest rates will remain structurally higher: Rising fiscal needs and persistent debt issuance will lead to a higher neutral rate. Macro backdrop: resilient growth, rising structural pressures AI supports activity, but regional divergence, inflation and fiscal risks persist
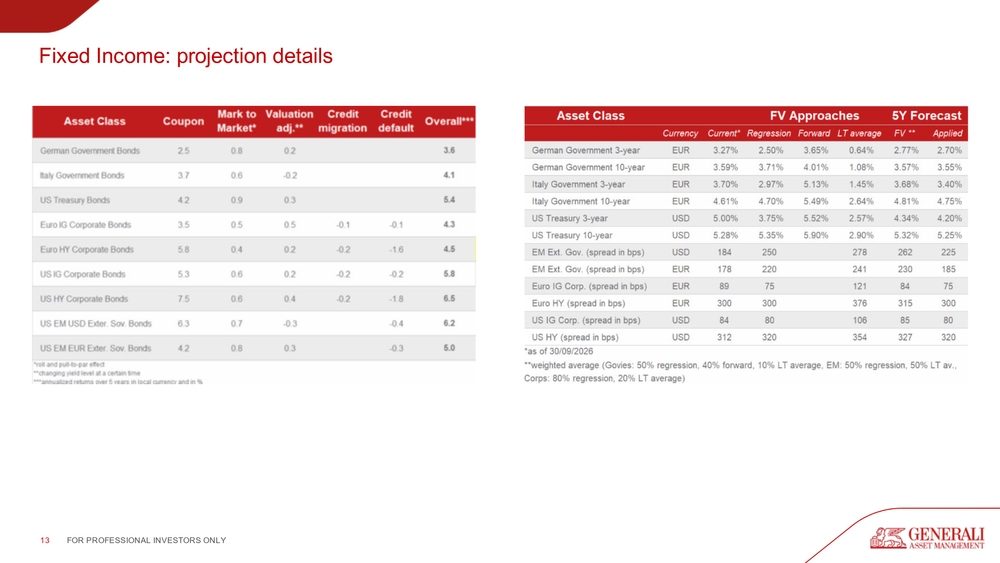
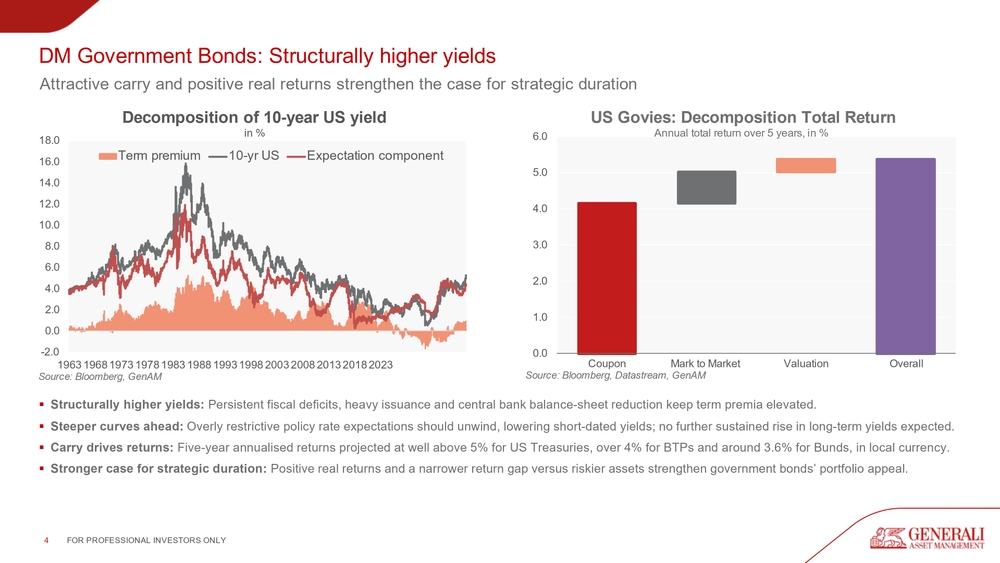
4 FOR PROFESSIONAL INVESTORS ONLY ▪ Structurally higher yields: Persistent fiscal deficits, heavy issuance and central bank balance-sheet reduction keep term premia elevated. ▪ Steeper curves ahead: Overly restrictive policy rate expectations should unwind, lowering short-dated yields; no further sustained rise in long-term yields expected. ▪ Carry drives returns: Five-year annualised returns projected at well above 5% for US Treasuries, over 4% for BTPs and around 3.6% for Bunds, in local currency. ▪ Stronger case for strategic duration:Positive real returns and a narrower return gap versus riskier assets strengthen government bonds’ portfolio appeal. DM Government Bonds: Structurally higher yields Attractive carry and positive real returns strengthen the case for strategic duration
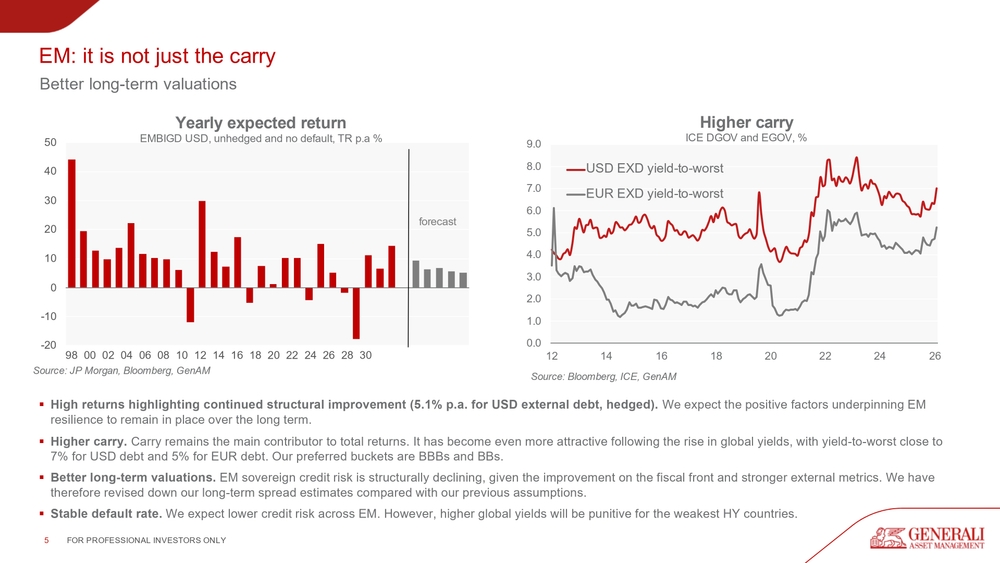
5 FOR PROFESSIONAL INVESTORS ONLY ▪ High returns highlighting continued structural improvement (5.1% p.a. for USD external debt, hedged). We expect the positive factors underpinning EM resilience to remain in place over the long term. ▪ Higher carry. Carry remains the main contributor to total returns. It has become even more attractive following the rise in global yields, with yield-to-worst close to 7% for USD debt and 5% for EUR debt. Our preferred buckets are BBBs and BBs. ▪ Better long-term valuations. EM sovereign credit risk is structurally declining, given the improvement on the fiscal front and stronger external metrics. We have therefore revised down our long-term spread estimates compared with our previous assumptions. ▪ Stable default rate. We expect lower credit risk across EM. However, higher global yields will be punitive for the weakest HY countries. EM: it is not just the carry Better long-term valuations
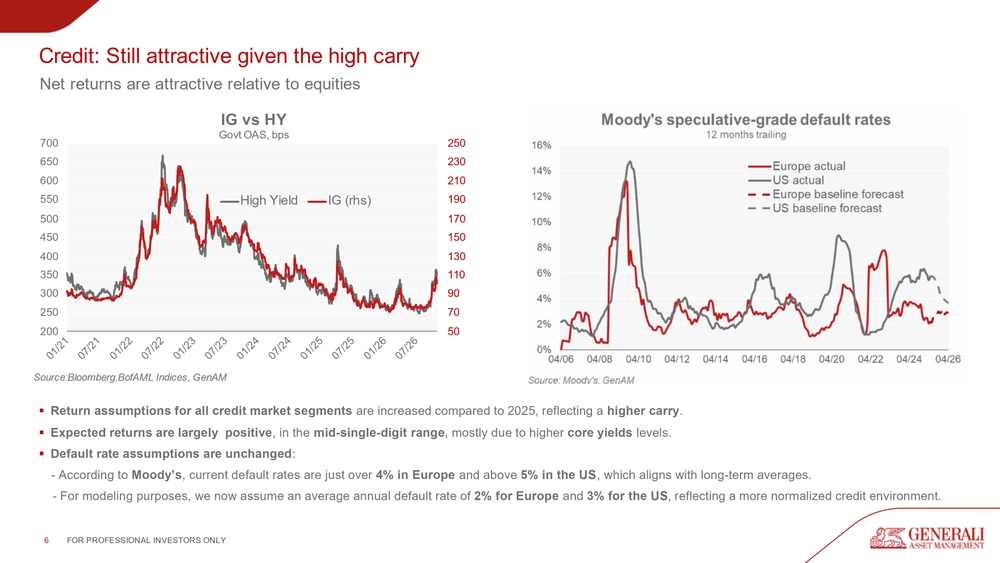
6 FOR PROFESSIONAL INVESTORS ONLY ▪ Return assumptions for all credit market segments are increased compared to 2025, reflecting a higher carry. ▪ Expected returns are largely positive, in the mid-single-digit range, mostly due to higher core yields levels. ▪ Default rate assumptions are unchanged:
- According to Moody’s, current default rates are just over 4% in Europe and above 5% in the US, which aligns with long-term averages.
- For modeling purposes, we now assume an average annual default rate of 2% for Europe and 3% for the US, reflecting a more normalized credit environment. Credit: Still attractive given the high carry Net returns are attractive relative to equities
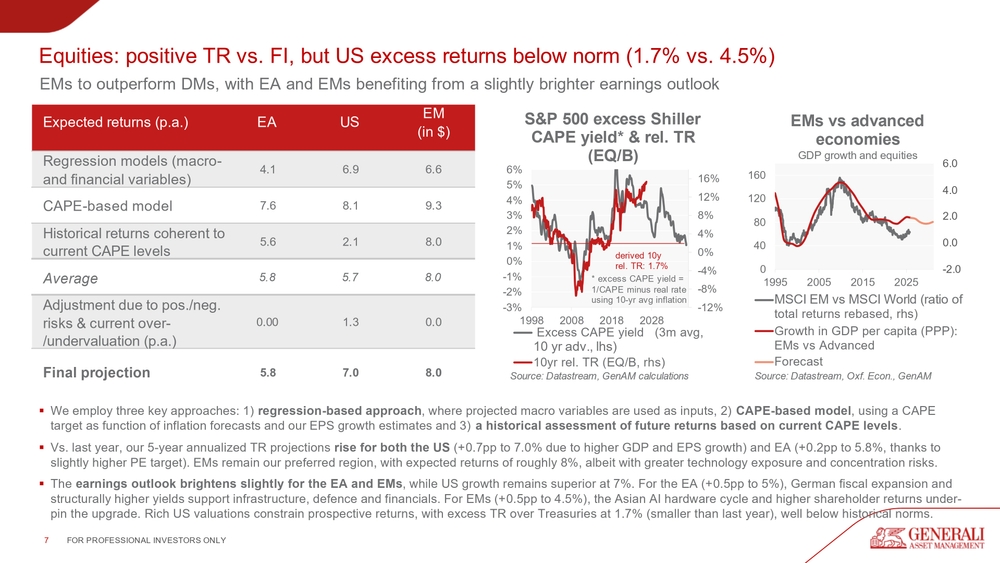
7 FOR PROFESSIONAL INVESTORS ONLY ▪ We employ three key approaches: 1) regression-based approach, where projected macro variables are used as inputs, 2) CAPE-based model, using a CAPE target as function of inflation forecasts and our EPS growth estimates and 3) a historical assessment of future returns based on current CAPE levels. ▪ Vs. last year, our 5-year annualized TR projections rise for both the US (+0.7pp to 7.0% due to higher GDP and EPS growth) and EA (+0.2pp to 5.8%, thanks to slightly higher PE target). EMs remain our preferred region, with expected returns of roughly 8%, albeit with greater technology exposure and concentration risks. ▪ The earnings outlook brightens slightly for the EA and EMs, while US growth remains superior at 7%. For the EA (+0.5pp to 5%), German fiscal expansion and structurally higher yields support infrastructure, defence and financials. For EMs (+0.5pp to 4.5%), the Asian AI hardware cycle and higher shareholder returns under- pin the upgrade. Rich US valuations constrain prospective returns, with excess TR over Treasuries at 1.7% (smaller than last year), well below historical norms. Equities: positive TR vs. FI, but US excess returns below norm (1.7% vs. 4.5%) EMs to outperform DMs, with EA and EMs benefiting from a slightly brighter earnings outlook -12% -8% -4% 0% 4% 8% 12% 16% -3% -2% -1% 0% 1% 2% 3% 4% 5% 6% 1998 2008 2018 2028 Excess CAPE yield (3m avg, 10 yr adv., lhs) 10yr rel. TR (EQ/B, rhs) Source: Datastream, GenAM calculations
- excess CAPE yield = 1/CAPE minus real rate using 10-yr avg inflation S&P 500 excess Shiller CAPE yield* & rel. TR (EQ/B) derived 10y rel. TR: 1.7% Expected returns (p.a.) EA US EM (in $) Regression models (macro- and financial variables) 4.1 6.9 6.6 CAPE-based model 7.6 8.1 9.3 Historical returns coherent to current CAPE levels 5.6 2.1 8.0 Average 5.8 5.7 8.0 Adjustment due to pos./neg. risks & current over- /undervaluation (p.a.) 0.00 1.3 0.0 Final projection 5.8 7.0 8.0 -2.0 0.0 2.0 4.0 6.0 0 40 80 120 160 1995 2005 2015 2025 EMs vs advanced economies GDP growth and equities MSCI EM vs MSCI World (ratio of total returns rebased, rhs) Growth in GDP per capita (PPP): EMs vs Advanced Forecast Source: Datastream, Oxf. Econ., GenAM
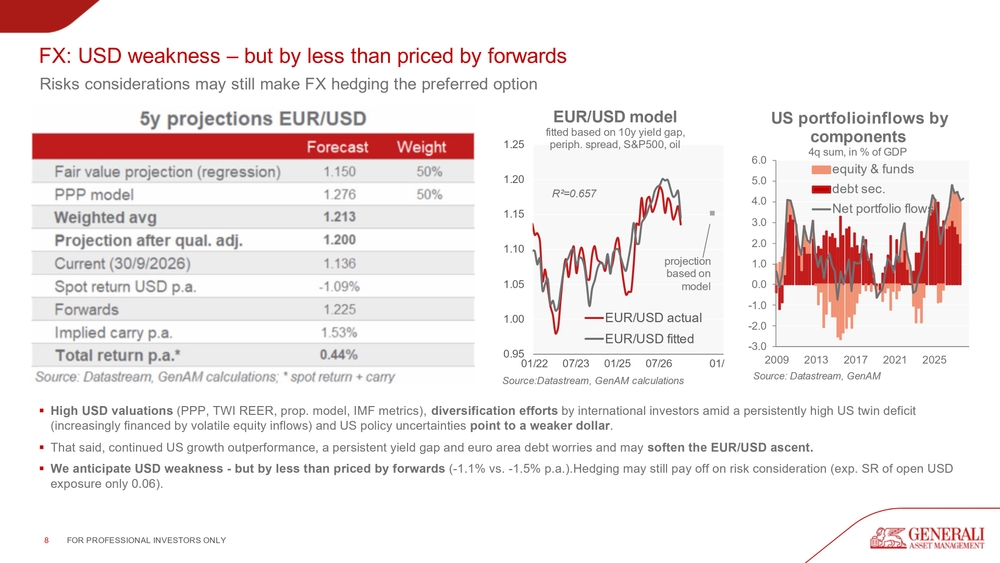
8 FOR PROFESSIONAL INVESTORS ONLY ▪ High USD valuations (PPP, TWI REER, prop. model, IMF metrics), diversification efforts by international investors amid a persistently high US twin deficit (increasingly financed by volatile equity inflows) and US policy uncertainties point to a weaker dollar. ▪ That said, continued US growth outperformance, a persistent yield gap and euro area debt worries and may soften the EUR/USD ascent. ▪ We anticipate USD weakness - but by less than priced by forwards (-1.1% vs. -1.5% p.a.).Hedging may still pay off on risk consideration (exp. SR of open USD exposure only 0.06). FX: USD weakness – but by less than priced by forwards Risks considerations may still make FX hedging the preferred option
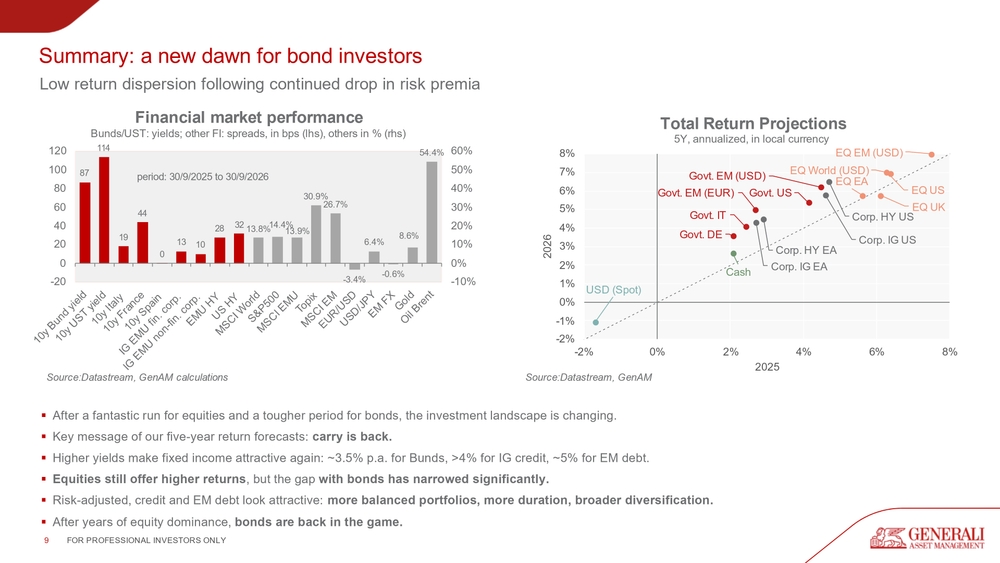
9 FOR PROFESSIONAL INVESTORS ONLY ▪ After a fantastic run for equities and a tougher period for bonds, the investment landscape is changing. ▪ Key message of our five-year return forecasts: carry is back. ▪ Higher yields make fixed income attractive again: ~3.5% p.a. for Bunds, >4% for IG credit, ~5% for EM debt. ▪ Equities still offer higher returns, but the gap with bonds has narrowed significantly. ▪ Risk-adjusted, credit and EM debt look attractive: more balanced portfolios, more duration, broader diversification. ▪ After years of equity dominance, bonds are back in the game. Summary: a new dawn for bond investors Low return dispersion following continued drop in risk premia
10 FOR PROFESSIONAL INVESTORS ONLY
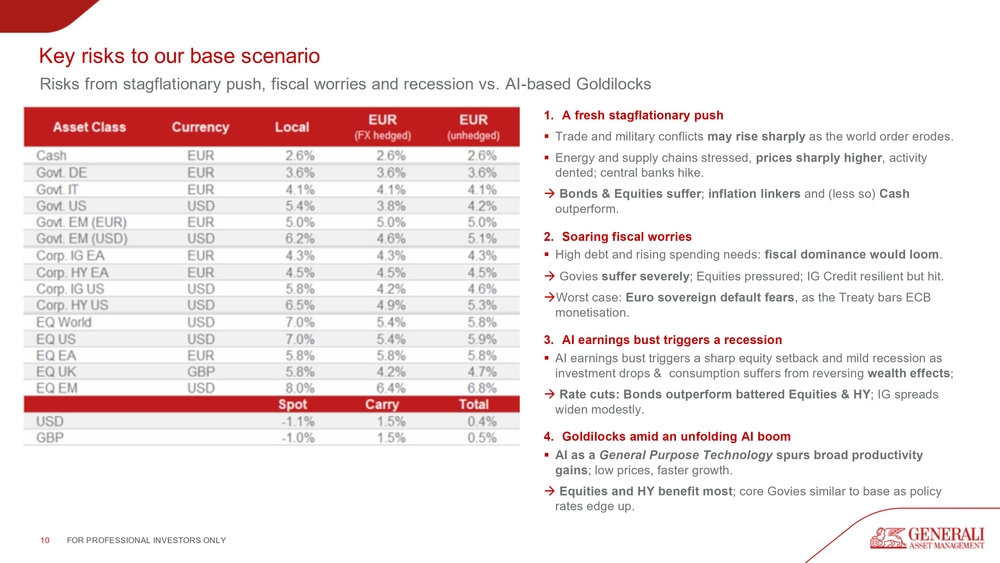
- A fresh stagflationary push ▪ Trade and military conflicts may rise sharply as the world order erodes. ▪ Energy and supply chains stressed, prices sharply higher, activity dented; central banks hike. → Bonds & Equities suffer; inflation linkers and (less so) Cash outperform.
- Soaring fiscal worries ▪ High debt and rising spending needs: fiscal dominance would loom. → Govies suffer severely; Equities pressured; IG Credit resilient but hit. →Worst case: Euro sovereign default fears, as the Treaty bars ECB monetisation.
- AI earnings bust triggers a recession ▪ AI earnings bust triggers a sharp equity setback and mild recession as investment drops & consumption suffers from reversing wealth effects; → Rate cuts: Bonds outperform battered Equities & HY; IG spreads widen modestly.
- Goldilocks amid an unfolding AI boom ▪ AI as a General Purpose Technology spurs broad productivity gains; low prices, faster growth. → Equities and HY benefit most; core Govies similar to base as policy rates edge up. Key risks to our base scenario Risks from stagflationary push, fiscal worries and recession vs. AI-based Goldilocks
11 FOR PROFESSIONAL INVESTORS ONLY APPENDIX

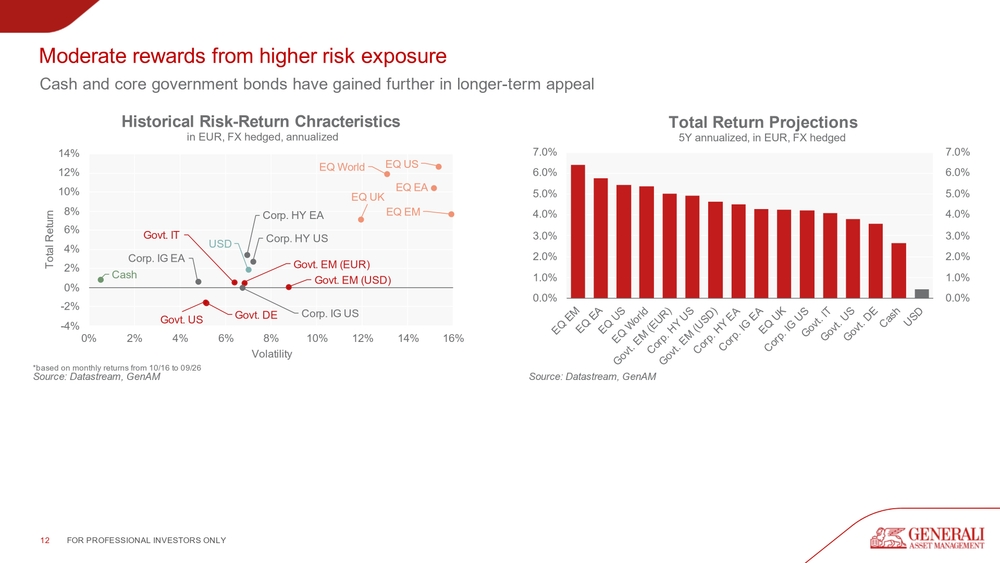
12 FOR PROFESSIONAL INVESTORS ONLY Moderate rewards from higher risk exposure Cash and core government bonds have gained further in longer-term appeal
13 FOR PROFESSIONAL INVESTORS ONLY Fixed Income: projection details