GenAM_Focal Point_equity outlook
by Generali Investments
Equit ies: stay OW through Q2 earnings, but trim exposure
Michele Morganti, Vladimir Oleinikov, and Federica Tartara
21 July, 2026
Your Partner for Progress. Generali Asset Management | Focal Point
Our Focal Point series explores topical issues on macro, markets and investment
• Equity markets remain supported by resilient global growth, still-favourable financial conditions and solid
earnings (EPS) , but the post -rally risk -reward has become less compelling amid renewed geopolitical uncer-
tainty, interest rate risks and AI monetisation concerns.
• US earnings are the key anchor to global equities , with strong results in Q1 and Q2 , positive revisions and
margins underpinned by pricing power , productivity gains and contained labour costs.
• Corporate fundamentals look sound, also helped by positive free cash flows (after capex needs), moderate
leverage and credit spreads alongside ongoing buyback and M&A activity.
• The EU is a laggard, but EPS growth is accelerating. A gradual H2 recovery and Germany's pro -growth policy
agenda should provide further support .
• A capex super -cycle is underway , driven by substantial investment in AI infrastructure, data centres, semi-
conductors, as well as electrification and the energy transition, supporting a broad er range of sectors . AI
benefits remain uneven, favouring hardware and infrastructure over software and IT services, while hyperscal-
ers face monetisation and capex scrutiny. Chinese AI competition is also on the rise.
• Our 12 -month total -return forecasts are around +5.5% for the S&P 500 and +6% for the EA, with upside to
around +16% and +11%, if ambitious IBES consensus estimates prove correct.
• We expect long -term returns to be lower than historical averages , reflecting elevated CAPE multiples and
compressed equity risk premia.
• We keep an OW equit y stance , albeit less aggressively, maintaining a cyclical sector bias and adding stronger
diversification. Equity dispersion has surged, pointing to greater vulnerability and strengthening the case for
broader sector and geographic diversification. Within equities, we are neutral Euro Area vs. the S&P 500 and
US Technology; OW DAX, MDAX, Russell MidCap ; and OW EMs, favouring Korea , Poland , slight ly China/China
Tech and tactical ly Indonesia.
Despite the Iran conflict, the global macroeconomic backdrop remains steady, and is likely to improve in 2H26 if, as we assume, the re -escalation in Iran is contained . Emerg- ing markets (EM) have shown greater resilience than in previous war episodes. The Euro Area is the weak spot, but stabilising sentiment , resilient domestic demand , solid labour markets, accumulated savings and ongoing fiscal support provide some cushion .
2 Generali Asset Management | Focal Point Germany’s recently agreed reform package provides an additional medium -term tail-
wind. Regulatory easing, including the European Commission’s call to relax bank lever-
age ratio constraints, and a more flexible EU competition policy should also support M&A
and investment activity over time. This ma cro mix keeps the baseline constructive for
equities, while the main risk scenario remains a broader geopolitical shock that would hit
energy prices, confidence and margins.
Earnings dynamics at the centre of equity resilienc e and positive returns
Profit growth is the key pillar supporting equity markets. In the U S, Q1 EPS rose by
around 27% year -on-year, with a high share of companies beating expectations. This
triggered sizeable upward revisions, reinforcing the constructive outlook for 2026.
The earnings recovery has also broadened : our median -stock analysis points to US
earnings growth accelerat ing to 13.3% in Q1 2026 from 9.5% in Q4 2025, while beat
ratios improved as well . This signals a healthier earnings backdrop and suggests the
recovery is extending beyond a narrow group of market leaders . Q2 is expected to deliver
another strong reporting season. US EPS growth should remain in the high -20% YoY
range, led by Technology, while the rest of the index should contribut e around 9 pp. Early
guidance has been strikingly positive, pointing to a solid earnin gs read -out, although el-
evated expectations may limit the scope for positive surprises. In Europe, profit momen-
tum also improved in Q1 . Positive surprises and revisions broadened beyond Energy and
Tech into Industrials, Materials and Banks, pointing to a healthier profit cycle. EU EPS
growth is set to accelerat e to 12–14% YoY in Q2 , supported by sustained upward revi-
argin proxy C C y mav of y ch G y abs change , rhs
C non-fin., core C
. . . . . . .
ndex rice ales m fwd E margin m fwd, rhs
ndex rice ales vs. margin m fwd est .
- -
m changes
exp. in m m lag of
cng
C E E m fwd,
cng, rhs
toxx
consensus expectations
o , actual estimates
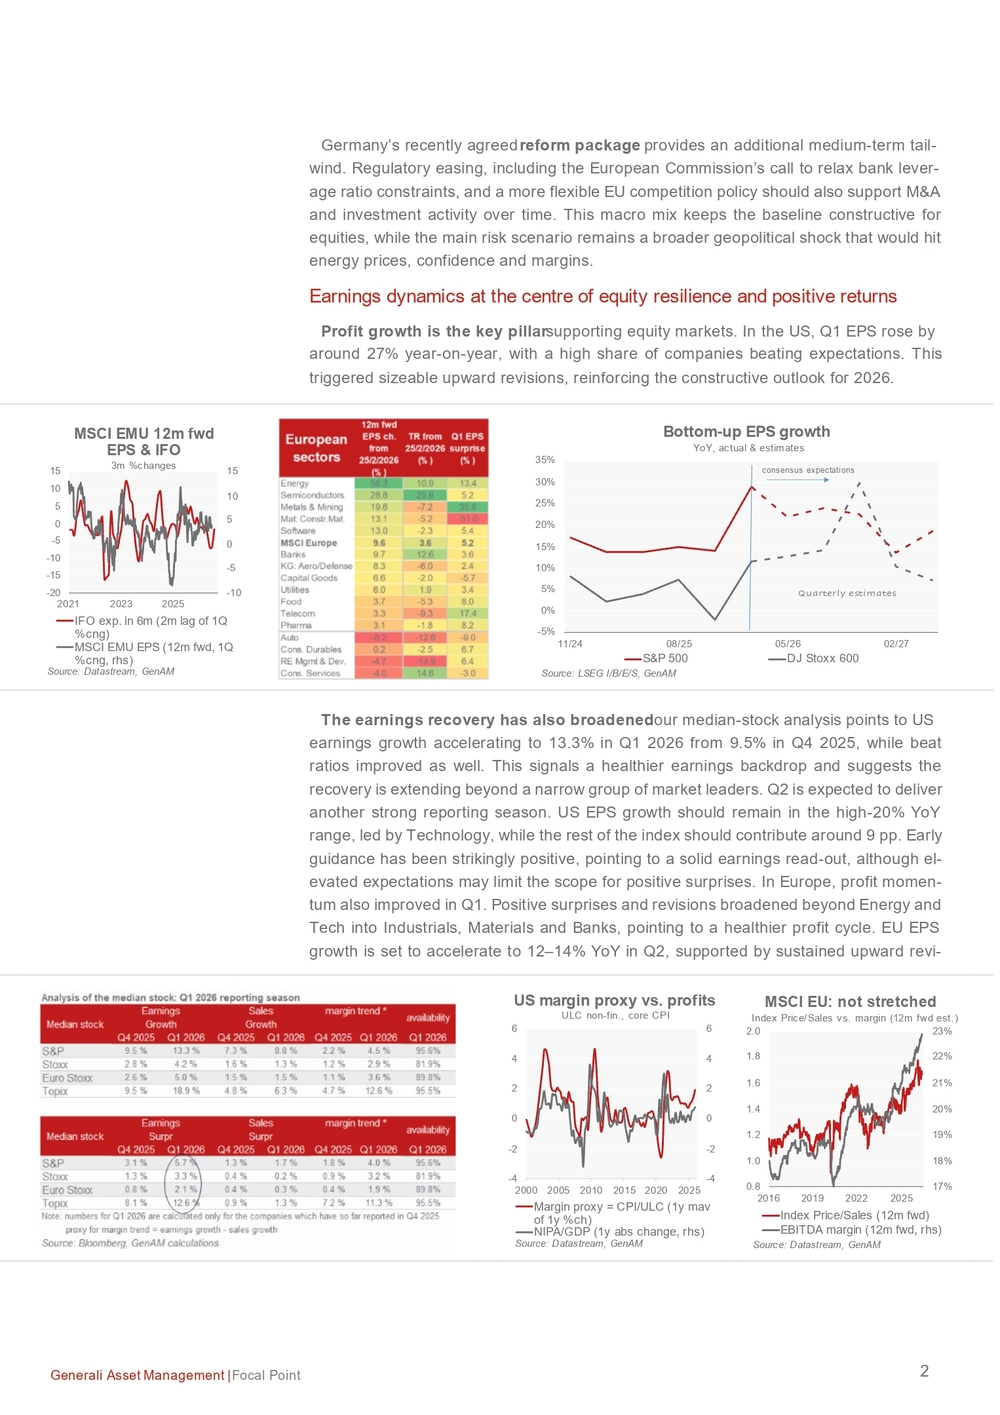
3 Generali Asset Management | Focal Point sions and leaving scope for modest positive beats. For 2026, we expect EPS growth of
18.5% in the US and 11% in EMU, still 4% and 7% below consensus , respectively .
Profitability Drivers
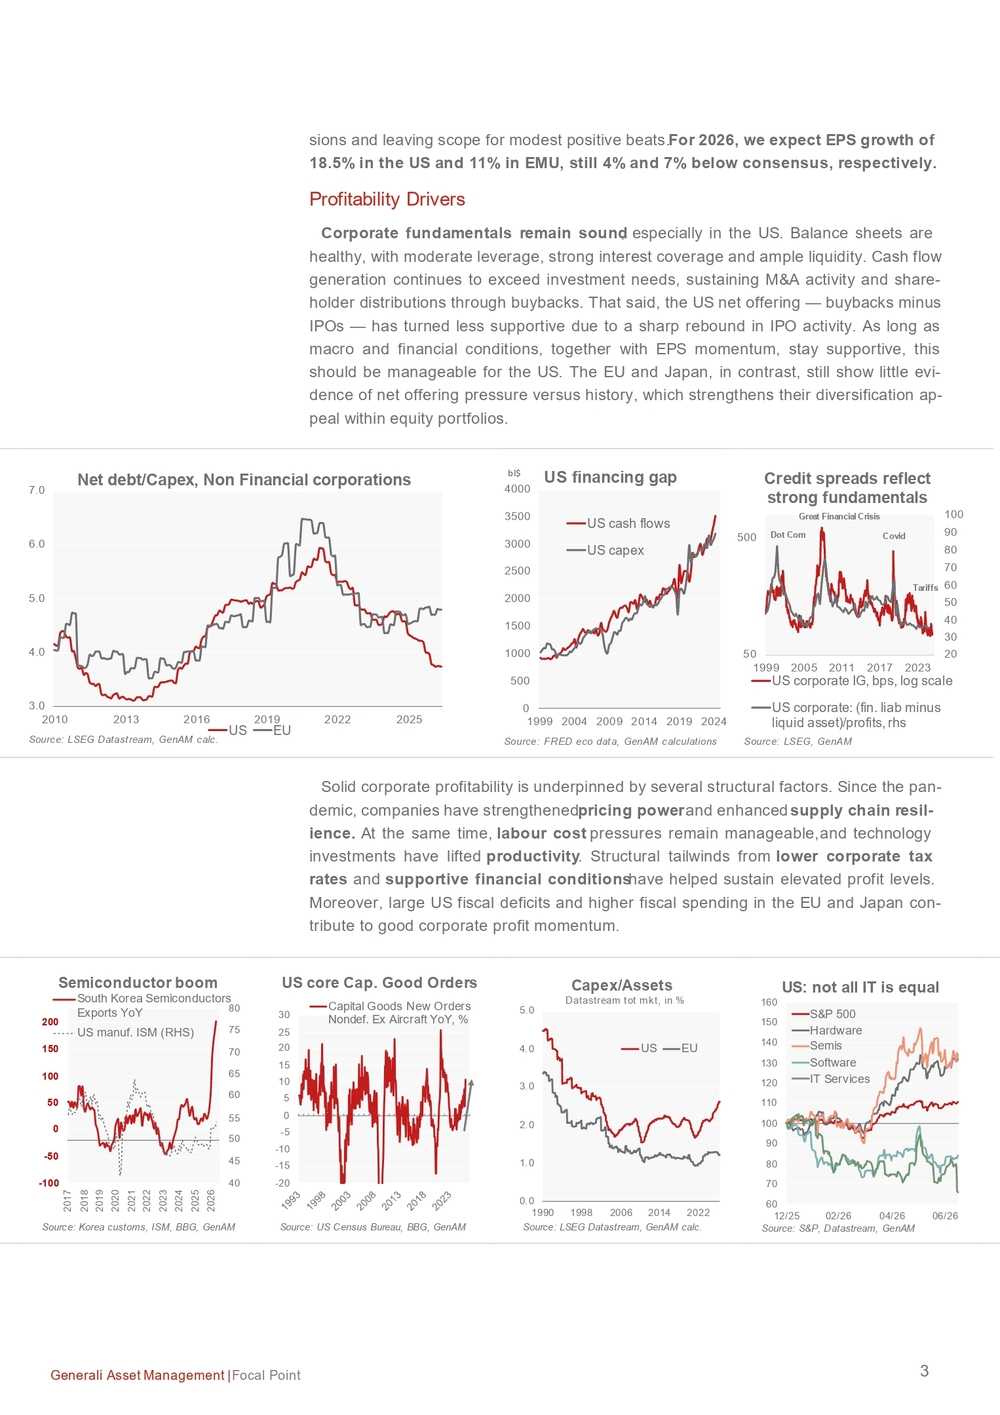
Corporate fundamentals remain sound , especially in the US. Balance sheets are
healthy, with moderate leverage, strong interest coverage and ample liquidity. Cash flow
generation continues to exceed investment needs, su staining M&A activity and share-
holder distributions through buybacks. That said , the US net offering — buybacks minus
IPOs — has turned less supportive due to a sharp rebound in IPO activity . As long as
macro and financial conditions, together with EPS momentum, stay supportive, this
should be manageable for the US . The EU and Japan, in contrast , still show little evi-
dence of net offering pressure versus history, which strengthens their diversification ap-
peal within equity portfolios.
Solid corporate p rofitability is underpinned by several structural factors. Since the pan-
demic , companies have strengthened pricing power and enhanced supply chain resil-
ience . At the same time , labour cost pressures remain manageable, and technology
investment s have lifted productivity . Structural tailwinds from lower corporate tax
rates and supportive financial conditions have helped sustain elevated profit levels.
More over, large US fiscal deficits and higher fiscal spending in the EU and Japan con-
tribute to good corporate profit momentum.
3.04.05.06.07.0 2010 2013 2016 2019 2022 2025 US EUNet debt/Capex, Non Financial corporations Source: LSEG Datastream, GenAM calc. 05001000150020002500300035004000 1999 2004 2009 2014 2019 2024US cash flows US capexUS financing gap Source: FRED eco data, GenAM calculationsbl$ 2030405060708090100 1999 2005 2011 2017 202350500 US corporate IG, bps, log scale US corporate: (fin. liab minus liquid asset)/profits, rhs Source: LSEG, GenAMDot ComGreat Financial Crisis Covid TariffsCredit spreads reflect strong fundamentals
outh orea emiconductors
Exports o manuf . R
-
-
-
-
Capital Goods ew rders
-
-
-
ondef. Ex ircraft o ,
. . . . . .
E
atastream tot mkt ,in
ardware emis oftware ervices
4 Generali Asset Management | Focal Point A further tailwind comes from a developing capex super -cycle , driven by sizeable in-
vestment in AI infrastructure, data centres, semiconductors, electrification, the energy
transition and related sectors . The US is setting the pace , while Europe remains held
back by structural bottlenecks , notably regulatory complexity, energy availability and cap-
ital allocation efficiency. This divergence is likely to widen regional profitability and growth
gaps . At the same time , AI adoption is broadening beyond the US, creating spillovers
across a wider range of regions and sectors.
Still, the scale of AI capex creates execution risk : benefits remain uneven ly distrib-
uted across the value chain. ardware and “pick -and-shovel” beneficiaries look better
supported, while IT services and software names have yet to prove that AI adoption can
translate into sustained revenue growth and margin expansion (see right chart above) .
Conversely, scrutiny is highest for the five hyperscalers. heir sharp capex increases
are set to weigh on near -term free cash flow, while funding needs are shifting more visibly
toward debt and equity markets. lthough ’s long -term E potential remains compel-
ling, the timing and scale of returns remain uncertain . his raises the risk of overinvest-
ment, lower incremental returns and a more selective view on winners. ower-cost
Chinese models add another risk, as corporates seek to reduce technology spending
and challenge the economics of more expensive large language models s .
Market Outlook
US v aluations remain well above historical norms on a long -term view, while Europe
and E Ms look less stretched. Near term, however, high margins, positive revisions and
strong earnings momentum still support valuations . Given the risks discussed above, US
equities — especially technology — entered this phase from relatively low PE levels ver-
sus norm , with subsequent profit upgrades further improving fair value estimates . In the
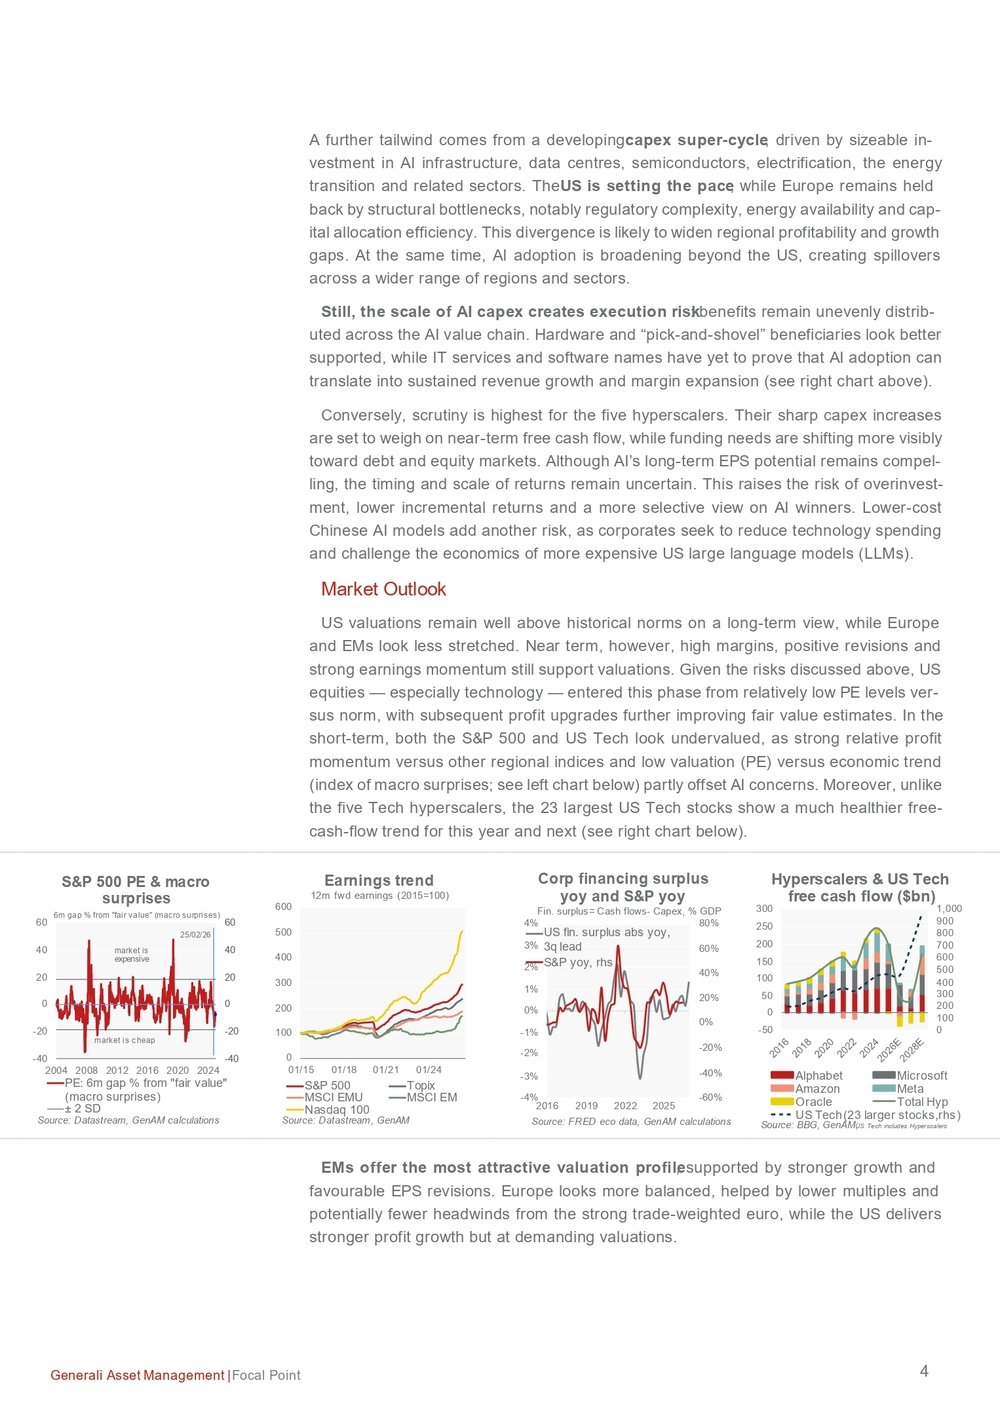
short -term, both the S&P 500 and US Tech look undervalued, as strong relative profit
momentum versus other regional indices and low valuation (PE) versus economic trend
(index of macro surprises ; see left chart below ) partly offset AI concerns. Moreover, unlike
the five Tech hyperscalers, the 23 largest US Tech stocks show a much healthier free -
cash -flow trend for this year and next (see right chart below).
EMs offer the most attractive valuation profile , supported by stronger growth and
favourable EPS revisions. Europe looks more balanced, helped by lower multiples and
potentially fewer headwinds from the strong trade -weighted euro , while the US delivers
stronger profit growth but at demanding valuations.
E m gap from fair value macro surprises
m gap from fair value macro surprises
market is cheapmarket is expensive
m fwd earnings
opix
C E C E
asdaq
fin. surplus abs yoy ,
q lead yoy, rhs
in. surplus Cash flows -Capex, G
,
lphabet icrosoft ma on eta racle otal yp ech
larger stocks ,rhs
5 Generali Asset Management | Focal Point Our 12 -month total -return forecasts are around 5.5% for the S&P 500 (target
7,700) and 6% for the Euro Area , with upside to around 16% ( 8,800 ) and 11% , if
IBES consensus estimates prove correct.
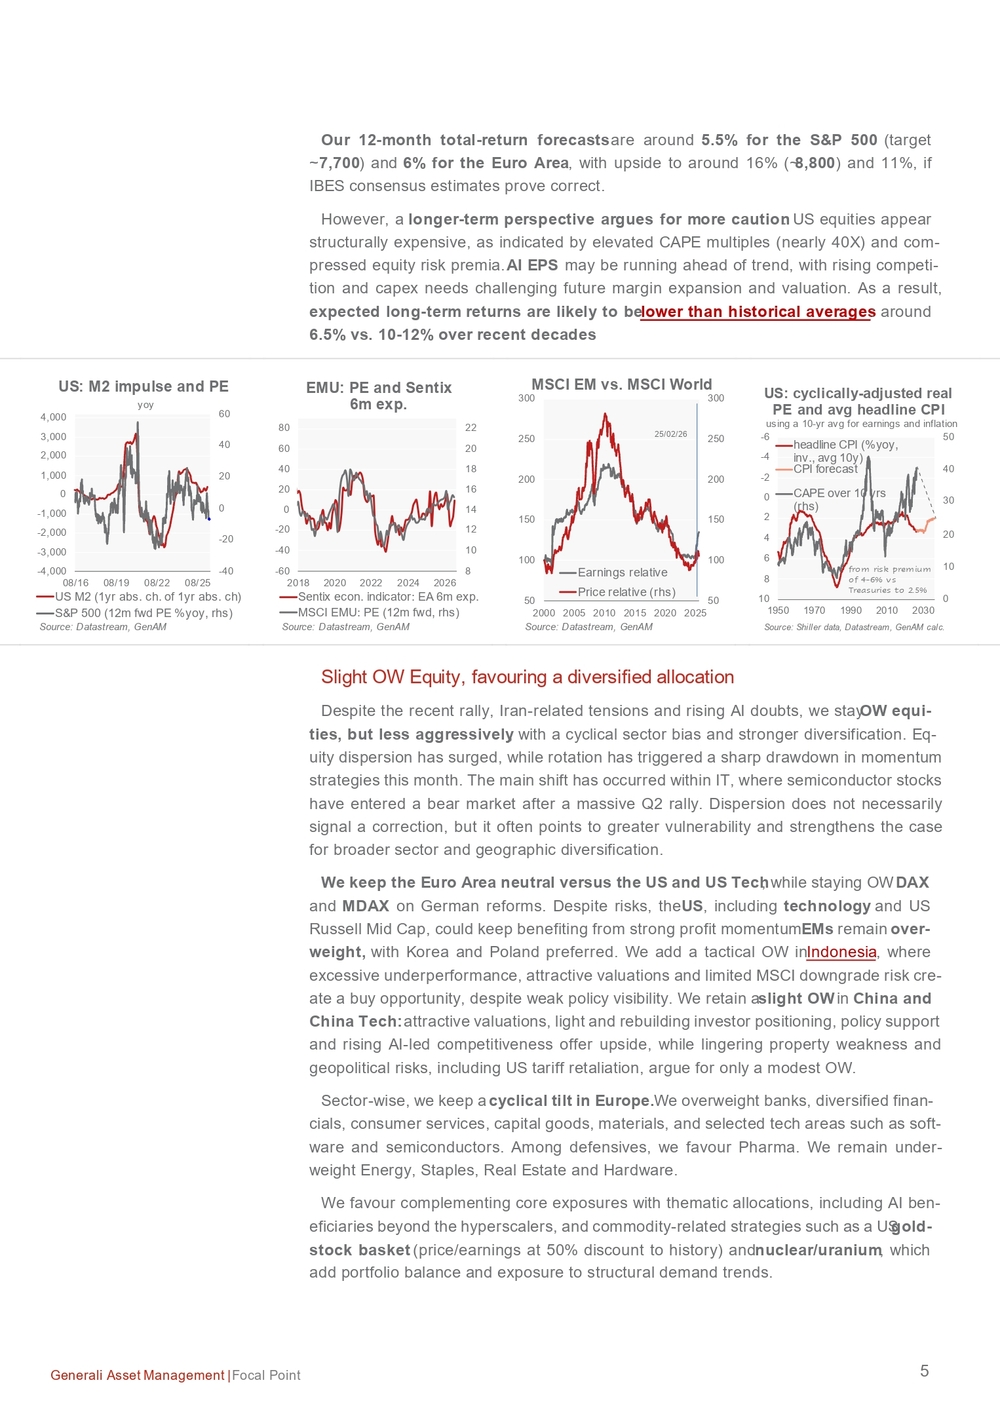
However, a longer -term perspective argues for more cautio n. US equities appear
structurally expensive, as indicated by elevated CAPE multiples (nearly 40X) and com-
pressed equity risk premia. AI EPS may be running ahead of trend, with rising competi-
tion and capex needs challenging future margin expansion and valuation. As a result,
expected long -term returns are likely to be lower than historical averages : around
6.5% vs. 10 -12% over recent decades .
Slight OW Equity , favo uring a diversified allocation
Despite the recent rally, Iran -related tensions and rising AI doubts, we stay OW equi-
ties, but less aggressively , with a cyclical sector bias and stronger diversification. Eq-
uity dispersion has surged, while rotation has triggered a sharp drawdown in momentum
strategies this month. The main shift has occurred within IT, where semiconductor stocks
have entered a bear market after a massive Q2 rally. Dispersion does not necess arily
signal a correction, but it often points to greater vulnerability and strengthens the case
for broader sector and geographic diversification.
We keep t he Euro Area neutral versus the US and US Tech , while staying OW DAX
and MDAX on German reforms. Despite risks, the US, including technology and US
Russell Mid Cap , could keep benefit ing from strong profit momentum. EMs remain over-
weight, with Korea and Poland preferred . We add a tactical OW in Indonesia , where
excessive underperformance, attractive valuations and limited MSCI downgrade risk cre-
ate a buy opportunity, despite weak policy visibility. We retain a slight OW in China and
China Tech: attractive valuations, light and rebuilding investor positioning , policy support
and rising AI-led competitiveness offer upside, while lingering property weakness and
geopolitic al risks, includ ing US tariff retaliation , argue for only a modest OW.
Sector -wise, we keep a cyclical tilt in Europe . We overweight banks, diversified finan-
cials, consumer services, capital goods, materials, and selected tech areas such as soft-
ware and semiconductors. Among defensives, we favour Pharma. We remain under-
weight Energy, Staples, Real Estate and Hardware .
We favour complementing core exposures with thematic allocations, including AI ben-
eficiaries beyond the hyperscalers , and commodit y-related strategies such as a US gold -
stock basket (price /earnings at 50% discount to history) and nuclear/uranium , which
add portfolio balance and exposure to structural demand trends.
-
-
, - , - , - , , , , ,
  yr abs. ch. of  yr abs. ch
     m fwd  E  yoy, rhs
yoy
entix econ . indicator E m exp. C E E m fwd, rhs
Earnings relative
rice relative rhs
-
-
headline C yoy,
inv., avg y C forecast C E over yrs rhs
using a -yr avg for earnings and inflation
6 Generali Asset Management | Focal Point Conclusion
Equities remain supported by resilient global economic growth, firm earnings momen-
tum and healthy corporate fundamentals . AI is the dominant structural theme, driving a
broad capex cycle. Still, elevated US CAPE multiples, compressed risk premia and high
mega -cap concentration leave little room for disappointment , while rising equity disper-
sion points to a more fragile market backdrop and reinforces the need for broader sector
and geographic diversification .
We therefore keep a slight equity overweight , but we pair it with strong er diversifica-
tion.
Our 12 -month base case points to upside of around +5.5% for the S&P 500 and +6%
for the Euro Area . In the upside scenario, these returns could rise to +16% and +11%,
if IBES estimates are met. Beyond that horizon, stretched US valuations and compressed
risk premia argue for below -average long-run returns.
The m ain risks to our constructive view are a severe escalation in geopolitical ten-
sions , especially in the Middle East, which could lead to a sustained energy shock,
weaker -than-expected growth in Europe and Asia , and higher -for-longer interest rates .
The latter would challenge current valuations, especially in growth sectors (Tech, Sta-
ples, Pharma , etc.).
An additional market -wide concern is that AI-related investment fails to deliver the
high returns currently expected , while large -scale US capex programmes could face
tighter financing conditions and increasing competition .
FOR PROFESSIONAL INVESTORS ONLY
www.generali -am.com
Part of
This document is based on information and opinions which Generali Asset Management S.p.A. Società di gestione del risparmio has obtained from sources within and outside of the Generali Group.
While such information is believed to be reliable for the purposes used herein, no representation or warranty, expressed or i mplied, is made that such information or opinions are accurate or com-
plete. The information, opinions estimates and forecasts expressed in this document are as of the date of this publication an d represent only the judgment of Generali Asset Management S.p.A.
Società di gestione del risparmio and may be subject to any change without notification. It shall not be considered as an explicit or implicit recommendation o f investment strategy or as investment
advice. Before subscribing an offer of investment services, each potential client shall be given every document provided by the regulations in force from time to time, documents to be carefully read
by the client before making any investment choice. Generali Asset Management S.p.A. Società di gestione del risparmio may have taken or, and may in the future take, investment decisions for the
portfolios it manages which are contrary to the views expressed herein. Generali Asset Management S.p. A. Società di gestione del risparmio relieves itself from any responsibility concerning mis-
takes or omissions and shall not be considered responsible in case of possible damages or losses related to the improper use of the information herein provided. It is recommended to look over the
regulation, available on our website www.generali -am.com . Generali Asset Management S.p. A. Società di gestione del risparmio is part of the Generali Group which was established in 1831 in
Trieste as Assicurazioni Generali Austro Italiche.
F
O
R
P
R
OPart of IMPRINT
Issued by: Generali Asset Management S.p.A.
Società di gestione del risparmio, Research Department
Head of Research: Vincent Chaigneau
Head of Macro & Market Research: Dr. Thomas Hempell, CFA
Team: Elisabeth Assmuth | Research Operations
Elisa Belgacem | Head of Cross -Asset Quant & Dev,
Senior Credit Strategist
Jakub Krátký | GI CEE Financial Analyst
Michele Morganti | Head of Insurance & AM Research,
Senior Equity Strategist
Vladimir Oleinikov | Senior Quantitative Analyst
Dr. Thorsten Runde | Senior Quantitative Analyst
Dr. Florian Späte, CIIA | Senior Bond Strategist
Guillaume Tresca | Senior Emerging Market Strategist
Dr. Martin Wolburg, CIIA | Senior Economist
Paolo Zanghieri, PhD | Senior Economist
“Edited by the acro arket Research eam. he team of 2 analysts based in Paris, Cologne, Trieste,
Milan and Prague runs qualitative and quantitative analysis on macroeconomic and financial issues. The
team translates macro and quant views into investment ideas that feed into the investment process.”